
Case Study
1. Introduction
1.1. What is Seymour?
Seymour is an open-source and easy-to-configure active monitoring solution that allows users to simulate requests from globally distributed locations to test their API endpoints. For each test, Seymour measures the availability, response time, and correctness of the API endpoint response. We built Seymour to help engineering teams bolster existing testing approaches and handle the challenges of monitoring their increasingly complex systems. It enables rapid detection of issues in production before users experience them. Seymour's infrastructure is easily deployed on an AWS account with two CLI commands.
1.2. What problem does Seymour Solve
Before we dive further into Seymour and active monitoring, let us take a step back and talk in general about how development teams minimize the risk of bugs reaching production. Many of the techniques for accomplishing this fall under the category of testing, which is the process of evaluating and verifying that software does what it is supposed to do. Good testing helps prevent bugs and can sometimes even help improve performance. Software tests are generally categorized based on purpose and scope. Common test types include:
- Unit tests: This type of test focuses on a small part of a software system. The "unit" may be one or many classes or functions. These tests are often run by an individual developer even after making small changes to a codebase and as part of CI/CD pipelines.
- Integration tests: In this approach, different parts of an application are tested together as a whole. These tests can find bugs in the interaction between components in a way that unit tests are not designed to. Remote systems are often mocked.
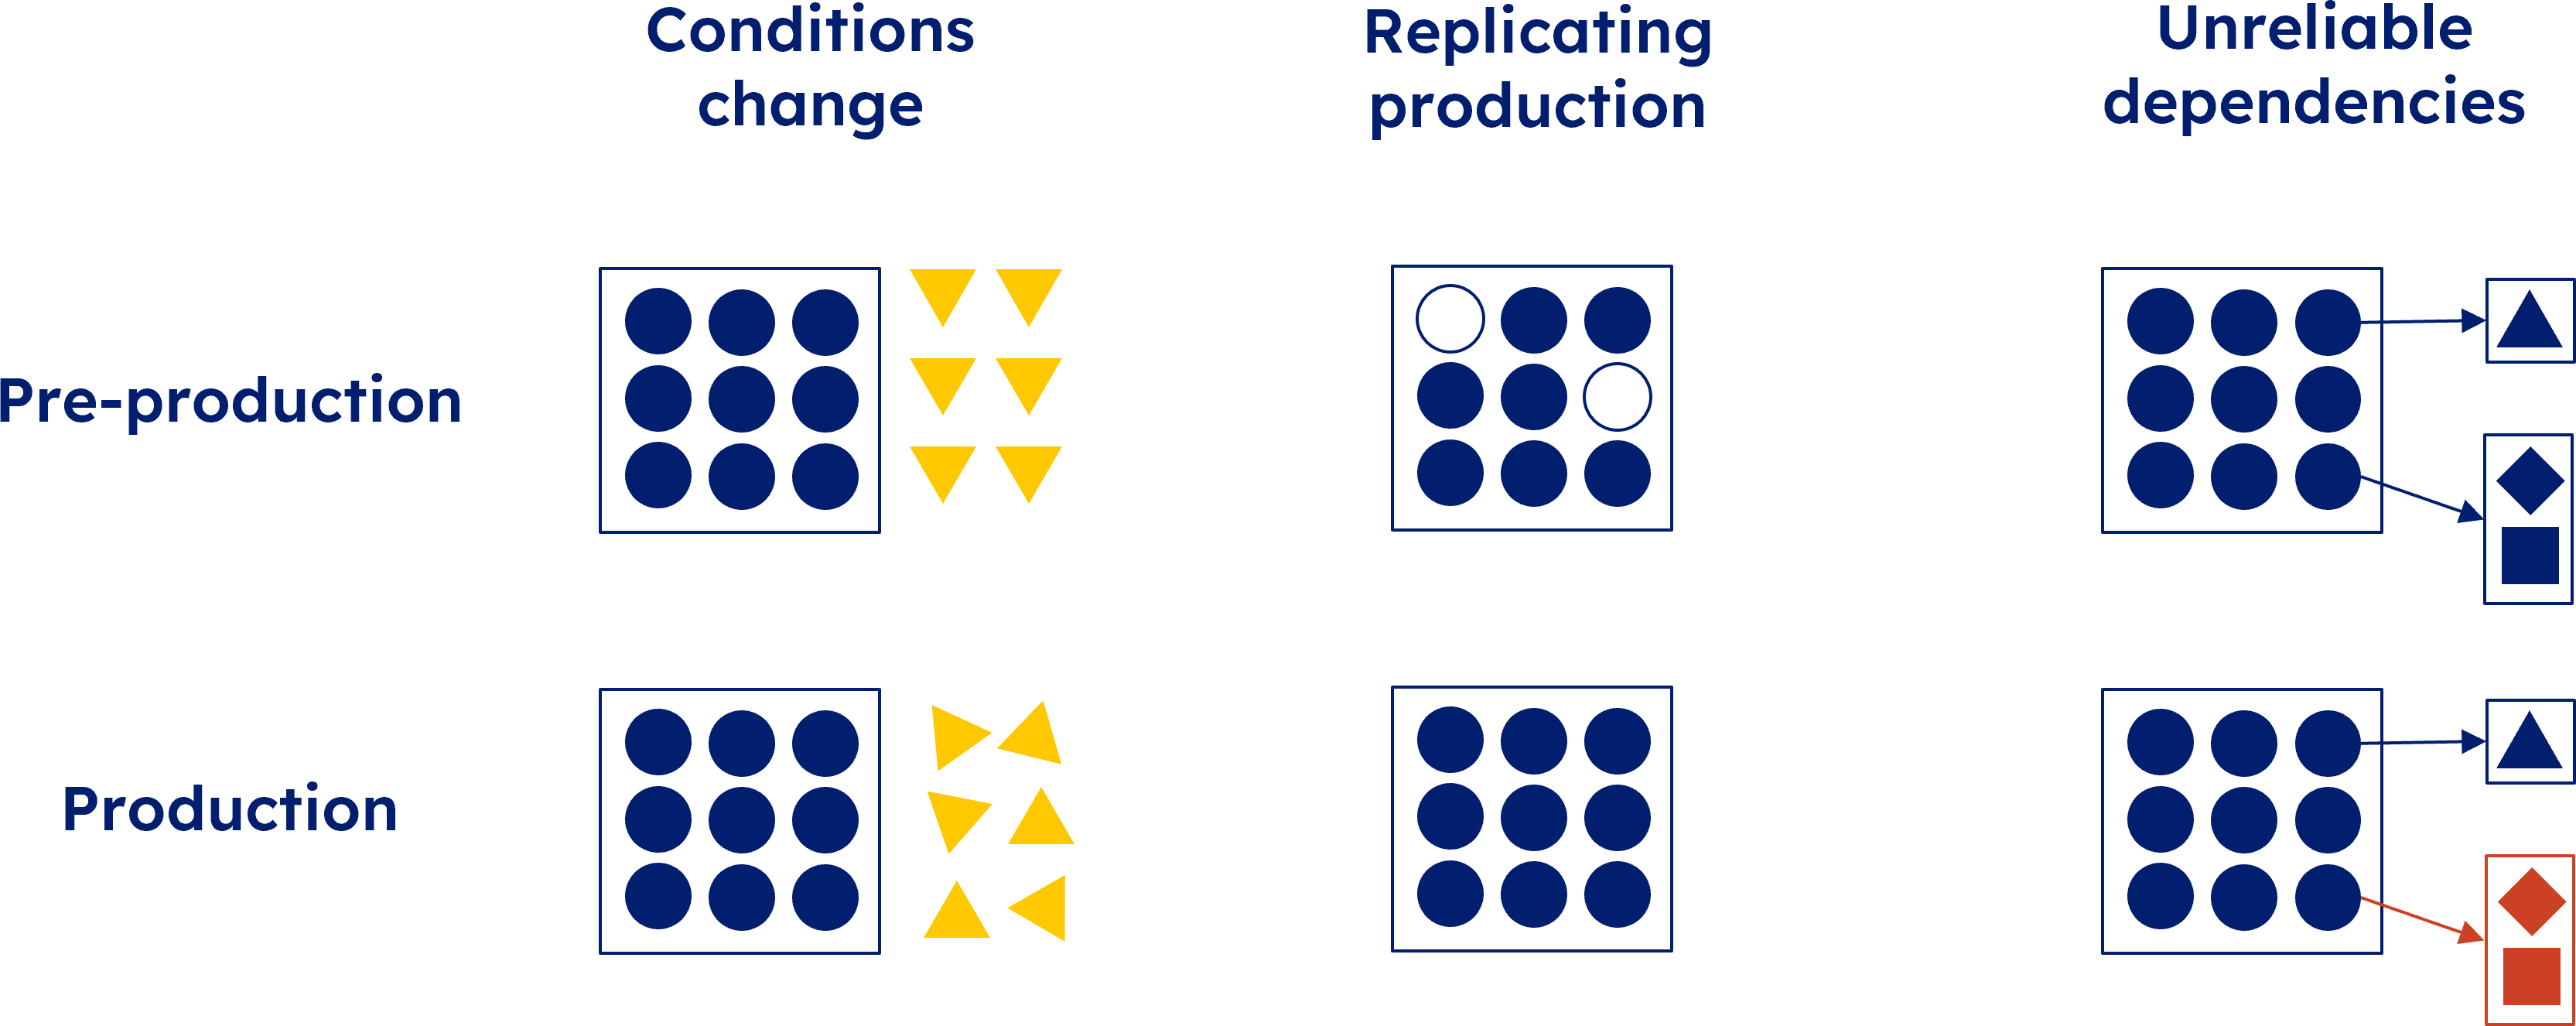
However, in spite of developers' best efforts to write good tests, issues still do arise in production. The reality is that conditions change and bugs can slip through the cracks.
Testing methods such as unit or integration tests can’t catch everything because they are often performed only during deployment, meaning tests are run only at a moment in time. It is also very difficult to perfectly replicate production in testing environments. This is especially true of modern, distributed systems. Finally, third-party service dependencies can prove to be unreliable.
On Martin Fowler’s website a contributor wrote this pertinent quote:
In the age of small independent services and frequent deployments, it's very difficult to test pre-production with the exact same combination of versions as they will later exist in production. [1]
What happens when issues do arise in production? The end user's experience may be degraded or even completely broken: response times can be higher than expected, response data can be incorrect or, maybe worst of all, an API can be completely unavailable. Rather than waiting for users to experience and surface such issues, it would be prudent to continuously test production API endpoints. This is exactly where active monitoring comes into play.
2. Active Monitoring
2.1. What is Active Monitoring
Active monitoring, also known as synthetic monitoring, is a technique that runs automated tests against a live production system on a regular basis in order to detect failing business requirements.
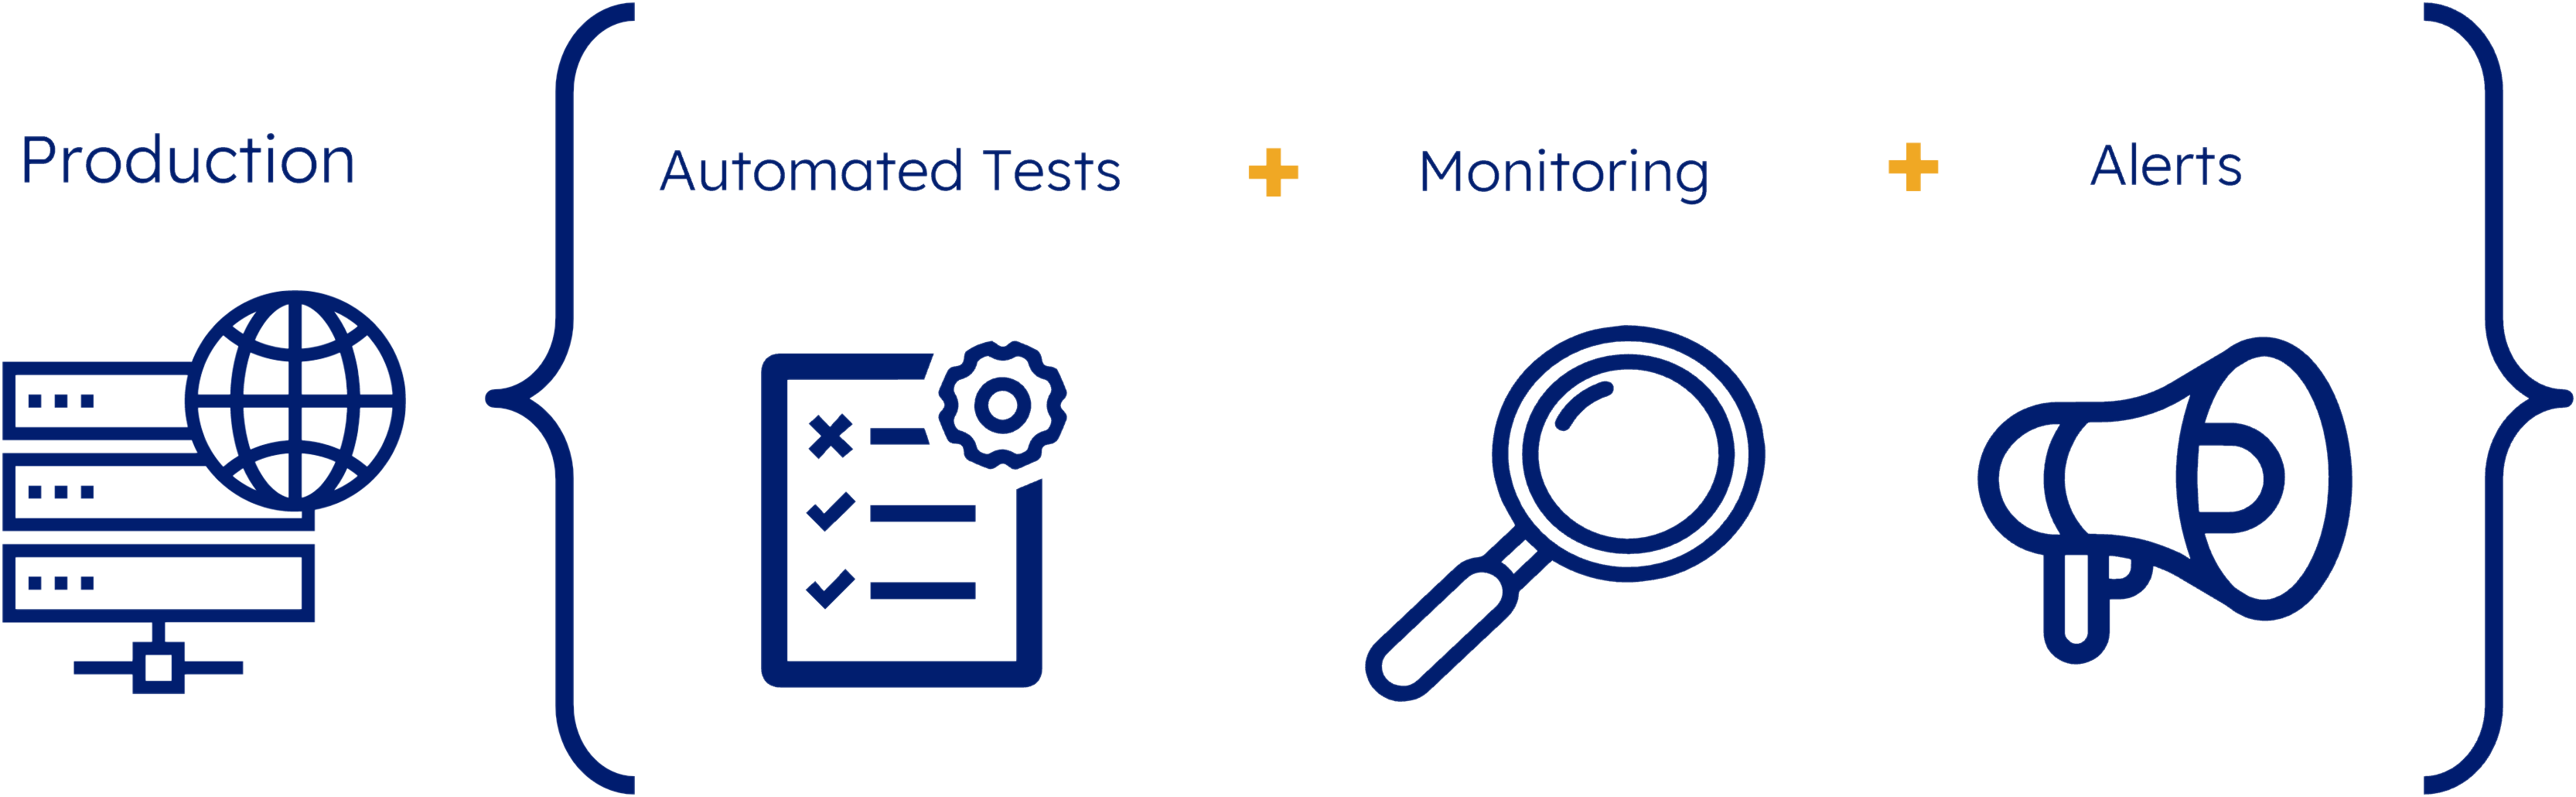
Active monitoring continuously monitors server and application performance, even during periods of low user engagement. The automated tests are written with API consumer expectations in mind to ensure the API provider continues to meet its commitments.
Active monitoring is generally used to test three things:
- Availability or “uptime”
- Latency, which is a measure of performance
- Correctness of response data
Below is an example test, which is comprised of two assertions:
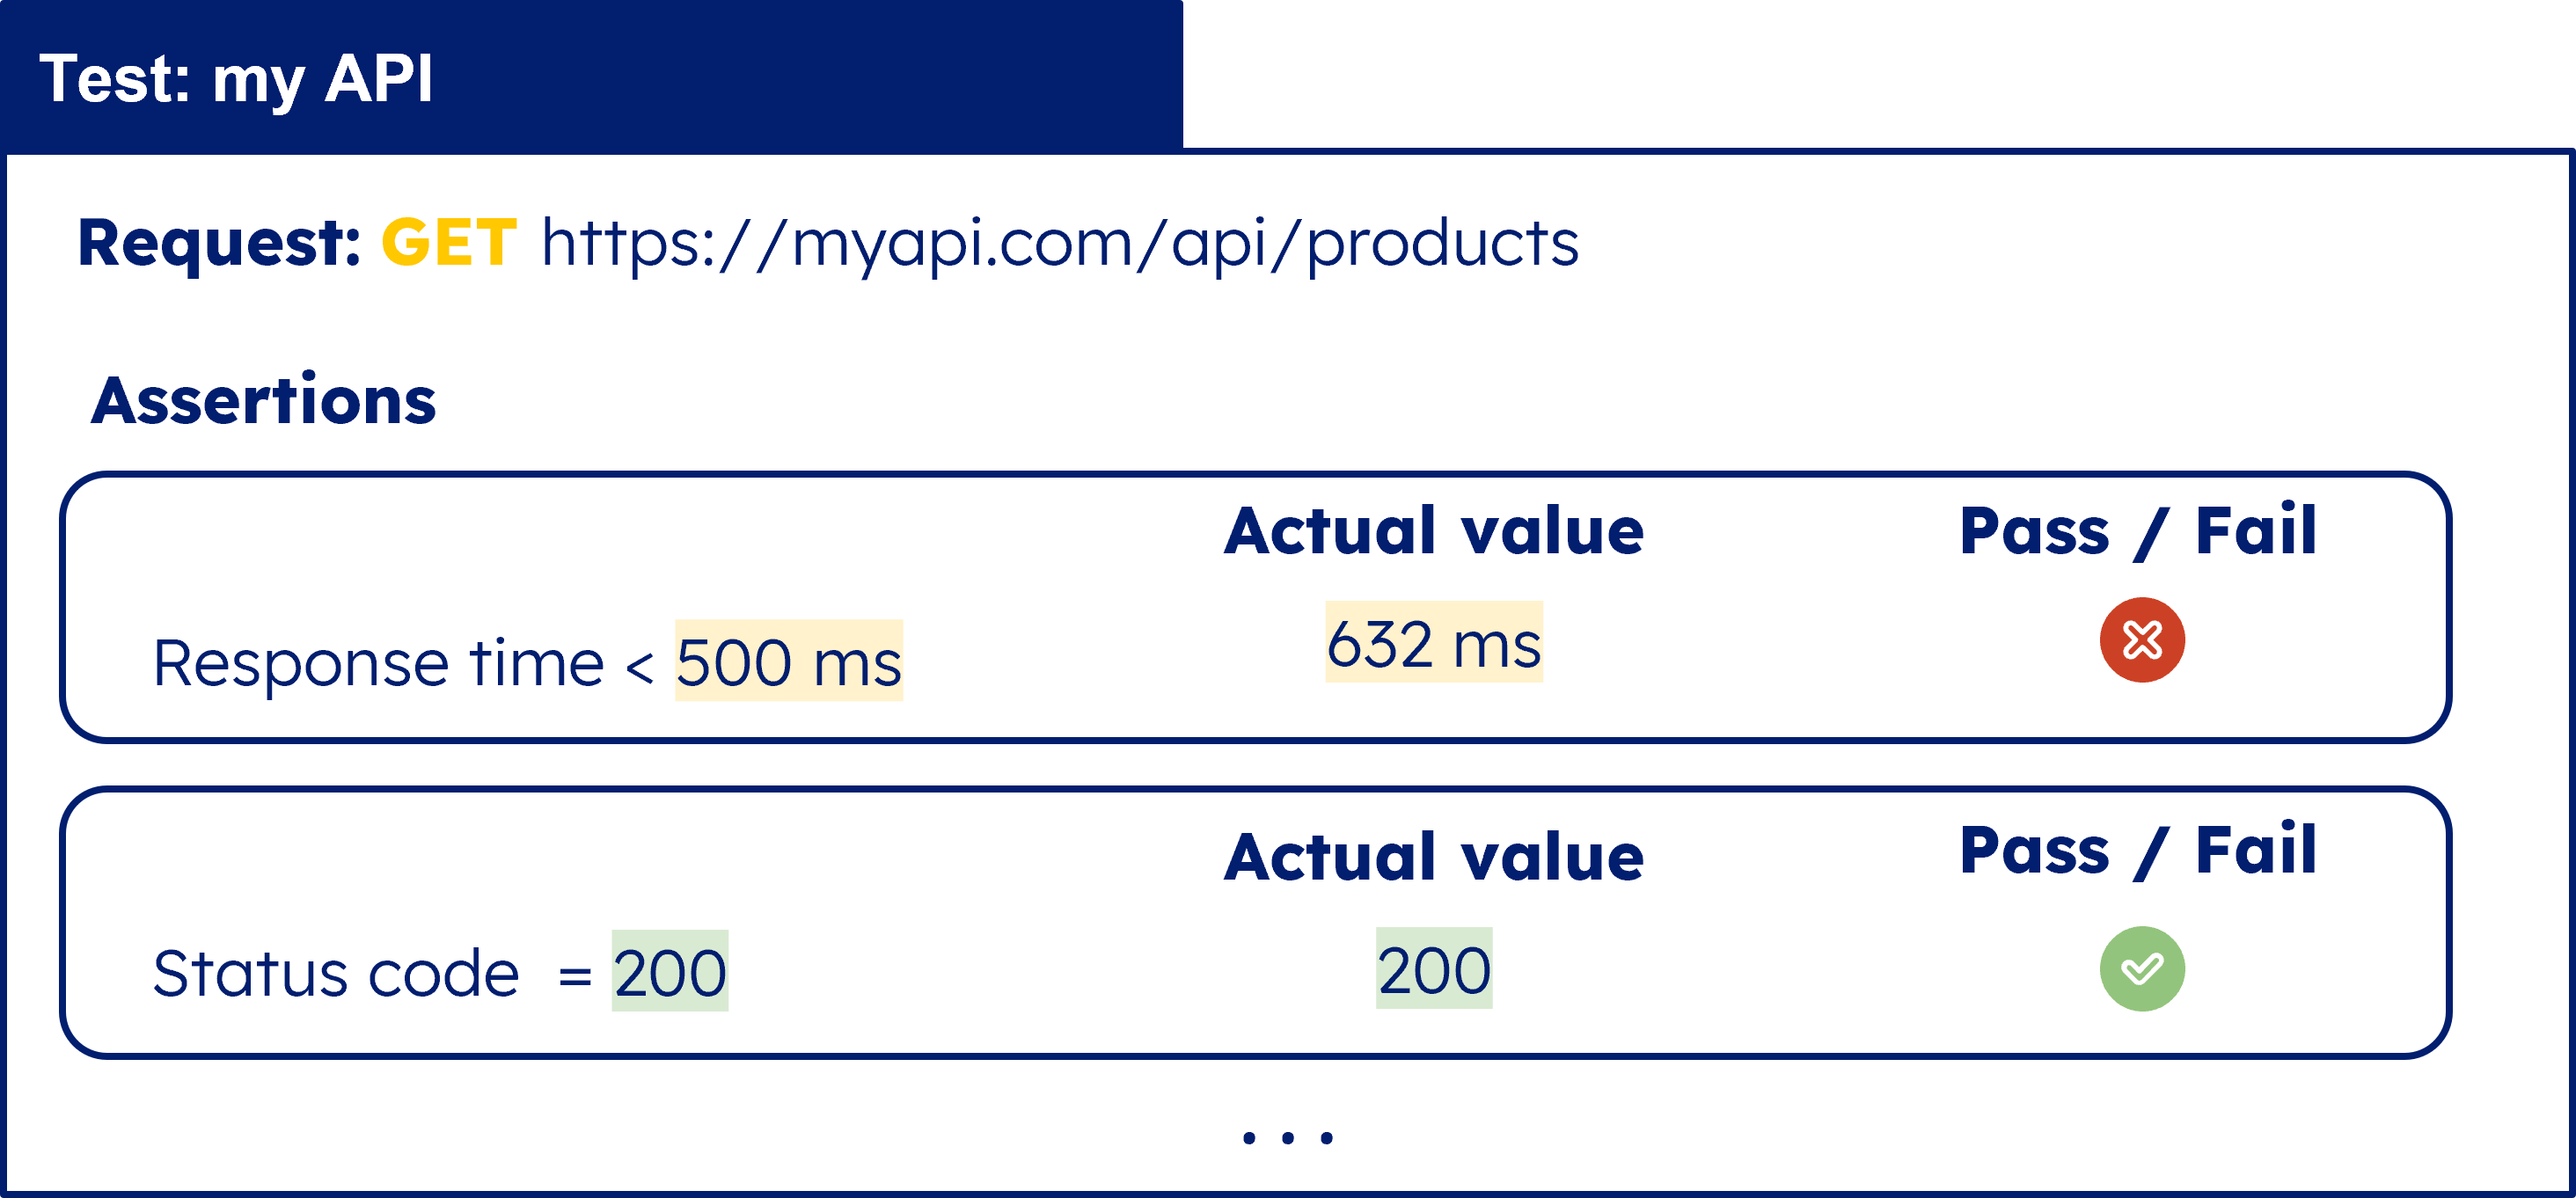
Here, we are asserting that a GET request to the example endpoint should return a response within 500 milliseconds. The actual response was completed in 632 milliseconds so the assertion would be considered a failure. In the second assertion, we are stating that the request should return a status code of 200. In this case, the actual status was 200, meaning the assertion is considered passing. Nevertheless, because our first assertion failed, the overall test is still considered failing. In the event a given test fails, on-call engineers can be notified through various channels such as Slack or email to begin troubleshooting the underlying problem.
2.2. Why is active monitoring important?
Things are bound to go wrong in a software production environment. Even with a well-maintained test environment, errors can still slip through the cracks and make their way into production. Rather than view this as a bad thing, engineering teams can see it as an opportunity to use active monitoring to identify problems in production before users do.
Active monitoring is especially important in the context of a microservices architecture. Take for example an API endpoint that is dependent on many different services, both internal and external, each of which may be deployed multiple times per day. Replicating all these services in local CI tests would be slow or fragile at best and may not be feasible at all.
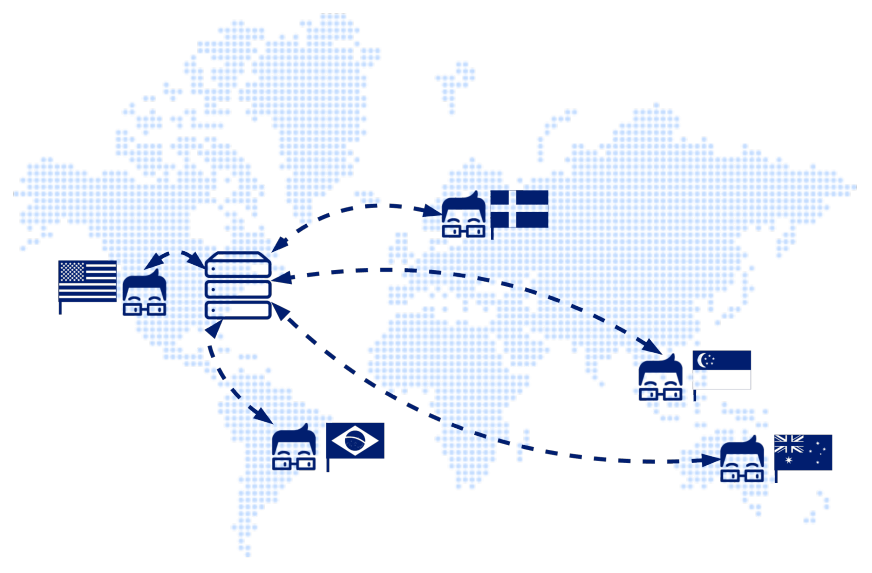
Furthermore, active monitoring solutions can often originate tests from locations all around the world. This provides insights into how an API is performing for users in specific geographic locations and helps to better diagnose if an issue is network-related.
By introducing active monitoring to a holistic testing strategy, engineering teams can sleep better at night knowing that bugs in production will surface fast, minimizing impact on users.
3. Solutions
3.1. Existing Solutions
There are quite a few active monitoring solutions. Some prominent SaaS vendors that offer this service are New Relic and Datadog, as well as smaller-scale companies like Uptrends, Checkly, and Runscope. There are also a handful of open-source solutions, such as Monika and Artillery (more commonly known for load testing). Besides using a SaaS or open-source active monitoring product, some teams may decide on a DIY approach and build their own in-house solution. Let’s weigh the pros and cons of each of these options by considering their various capabilities and feature sets.
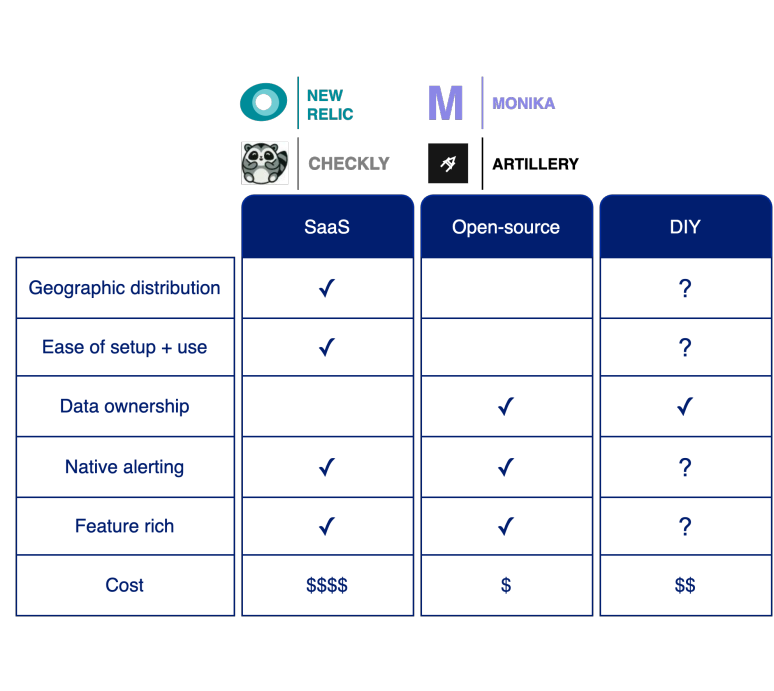
3.1.1. Software as a Service (SaaS)
In general, SaaS active monitoring products offer geographic distribution of request locations. These solutions are managed, meaning there’s minimal setup required from the customer to configure their first test. Most of the interactions with these SaaS products, including New Relic and Checkly, are through a UI, which makes setting up new tests easy for all users, including non-engineers. SaaS solutions typically offer a wide variety of features, including native alerting over a variety of channels, teardown scripts, and integration into CI/CD pipelines. All of this functionality, some of which might not be needed for a given use case, does come at a direct financial cost: SaaS solutions are the most expensive option. Another drawback of a managed solution is the lack of data ownership. This might be a deal breaker for some organizations, such as financial institutions, who don’t want their test data residing on a third-party provider’s infrastructure.
3.1.2. Open-source
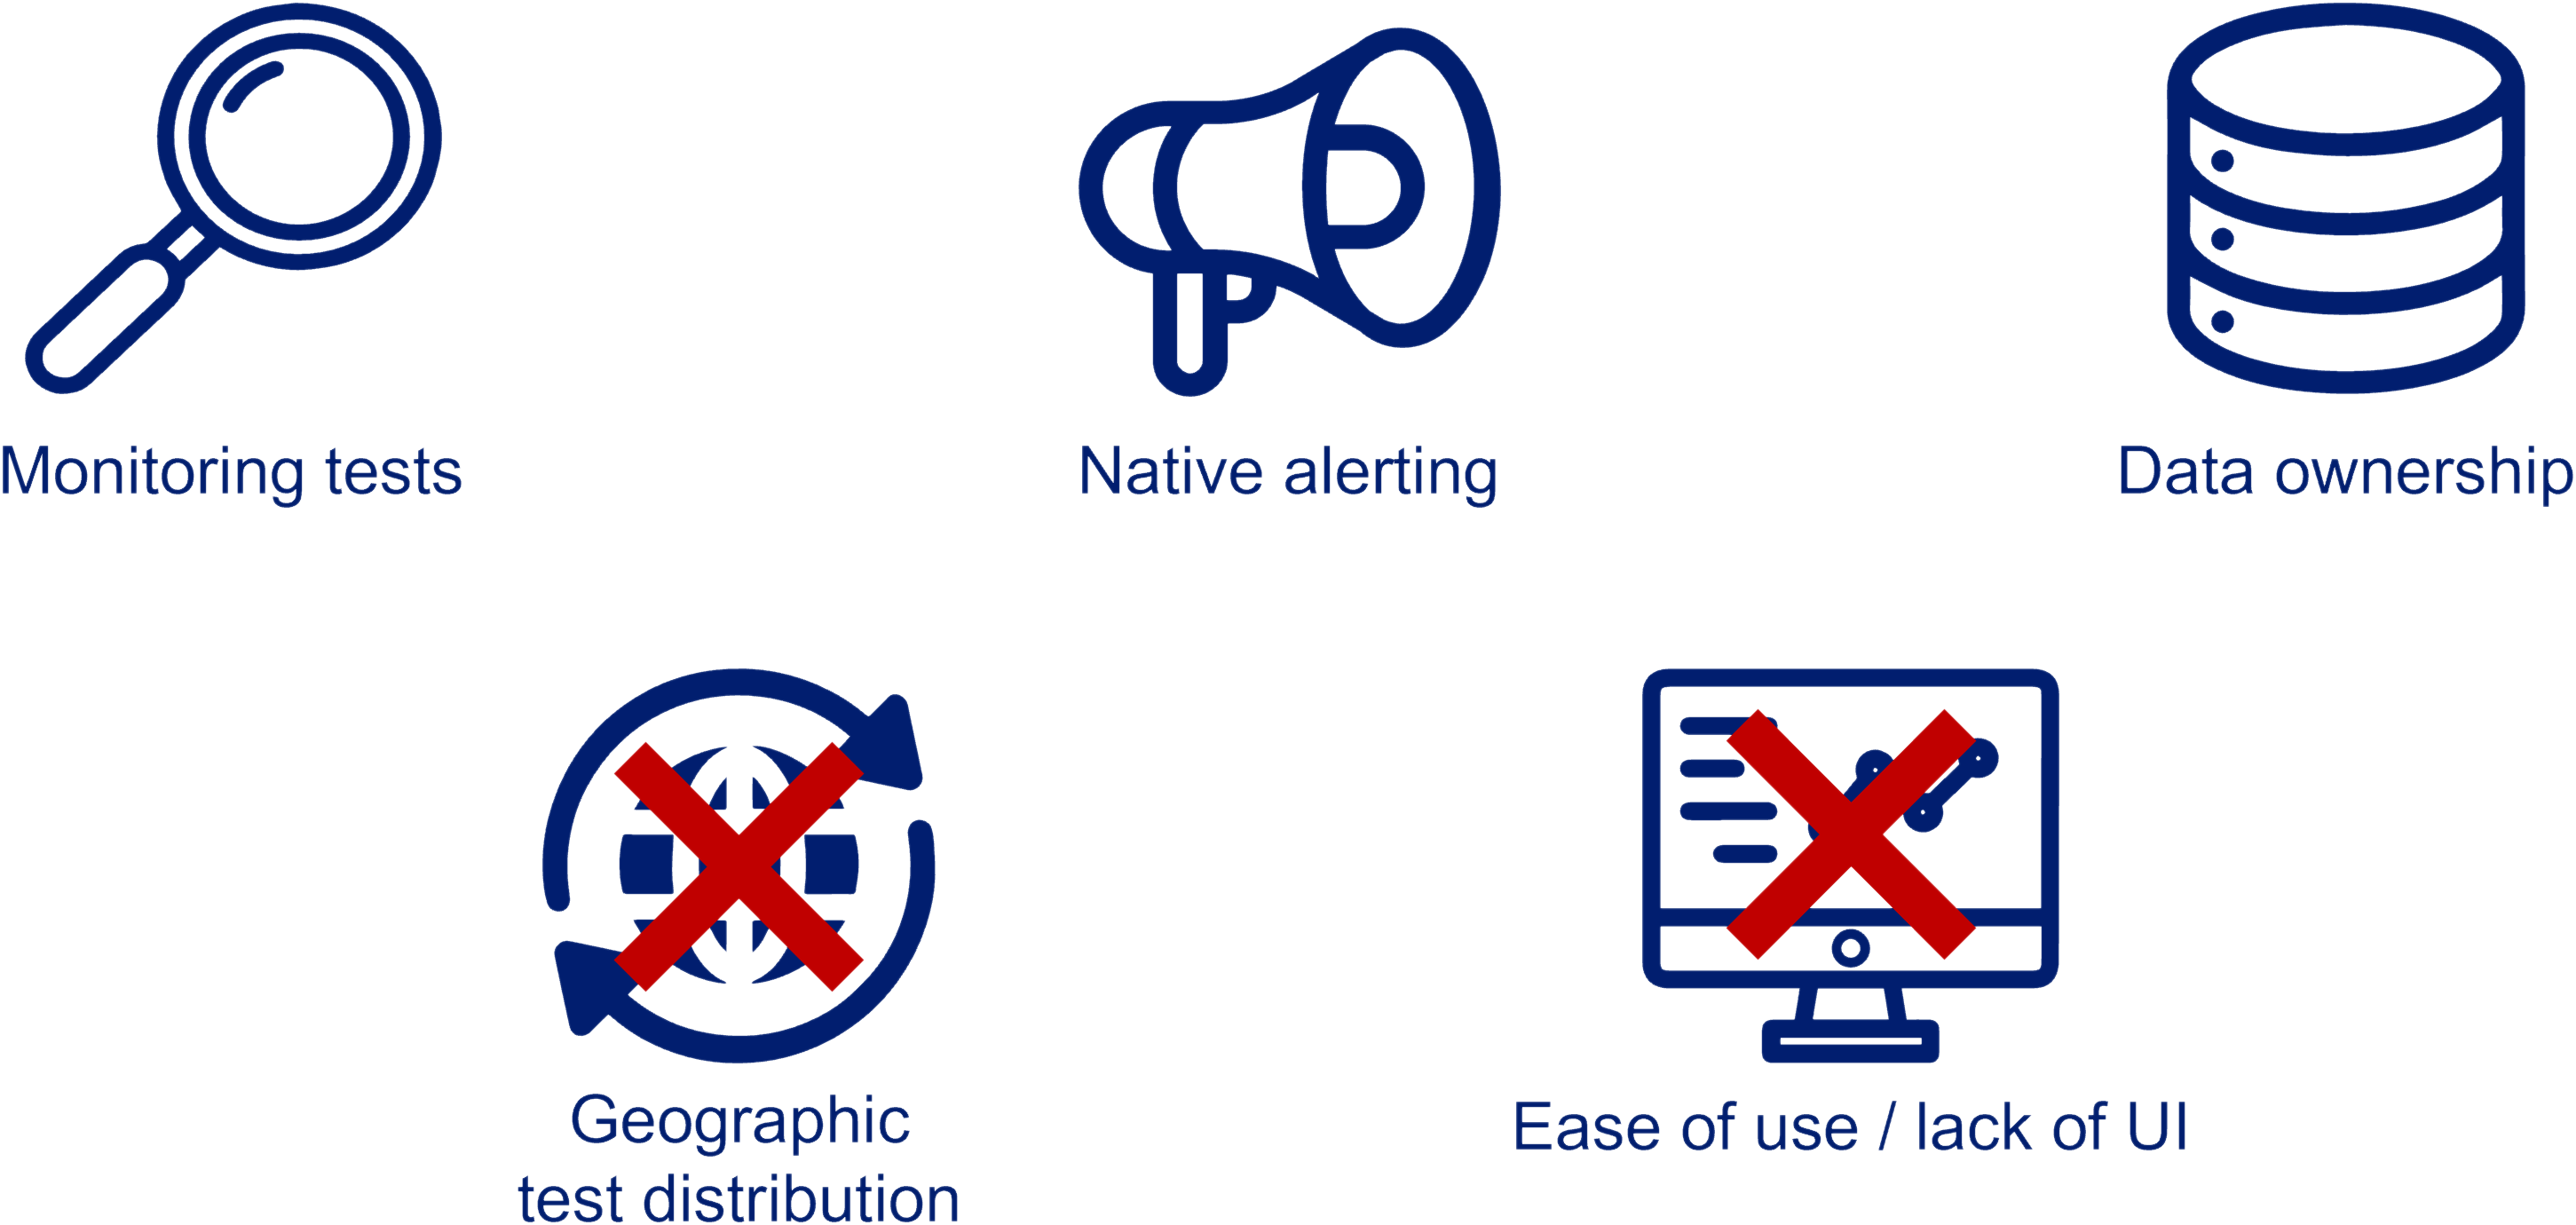
On the other hand, open-source solutions allow users to maintain complete control over their data and are usually free. However, they don’t typically offer geographic distribution of tests, at least in their free tiers. Additionally, these solutions require hosting and are more laborious to set up and use as compared to SaaS solutions. Both Monika and Artillery, for instance, are set up via a multi-step process, and tests are configured via YAML. There is no UI.
3.1.3. DIY
Finally, we have in-house solutions. These could entail either building a system from the ground up or wrapping an existing open-source solution like Monika. A major appeal of this approach is that it can be customized to fit users’ specific needs, which can of course include maintaining complete control over their data. Drawbacks of this approach include the need to deploy and maintain the finished application as well as the amount of time and effort required to develop such a solution, diverting engineering resources that could be otherwise spent on more mission-critical tasks.
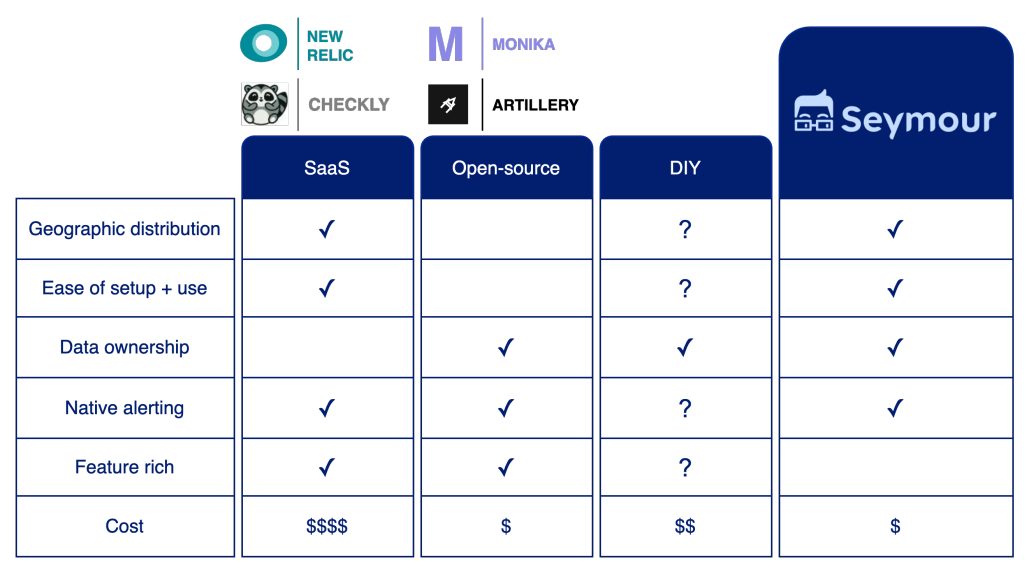
3.2. Introducing Seymour
Having surveyed available active monitoring solutions, what we found missing was an open-source, self-hosted, easy-to-configure monitoring solution that can run tests from globally distributed locations.
That’s why we built Seymour. Out of the box, Seymour provides geographic distribution of tests, allowing users to configure tests originating from 22 global locations. Deploying Seymour requires only two CLI commands. Once it is set up, Seymour provides a UI for configuring and viewing all tests and alerts, along with an API for programmatic configuration. Because Seymour is open-source and self-hosted, it allows users to maintain ownership of their data. Seymour enables users to configure alerts to be sent over one or more of three channels including e-mail, Slack, and Discord. And finally, since the only cost of Seymour is the cost of the AWS infrastructure it runs on, it’s inexpensive, especially relative to its SaaS counterparts. However, we built Seymour with a specific use-case in mind so it does not provide as many features as Saas and open-source active monitoring options.
3.3. UI/ UX Demo
3.4. Deployment
In order to start using Seymour, an AWS account is required. Once that’s set up, the remaining steps are as follows:
- Clone the Seymour infra-setup repo
- Run two CLI commands to spin up the necessary resources in an AWS account
- Enter the generated URL in a browser
With that done, Seymour is ready to go! One thing worth noting is that the provisioning of AWS resources, while automated, may take upwards of 20 minutes, primarily due to the provisioning of resources in 22 regions.
4. Seymour's architecture
4.1. Overview
Seymour’s infrastructure is loosely organized into four main sections which together make up the lifecycle of a single test, the “test loop”.
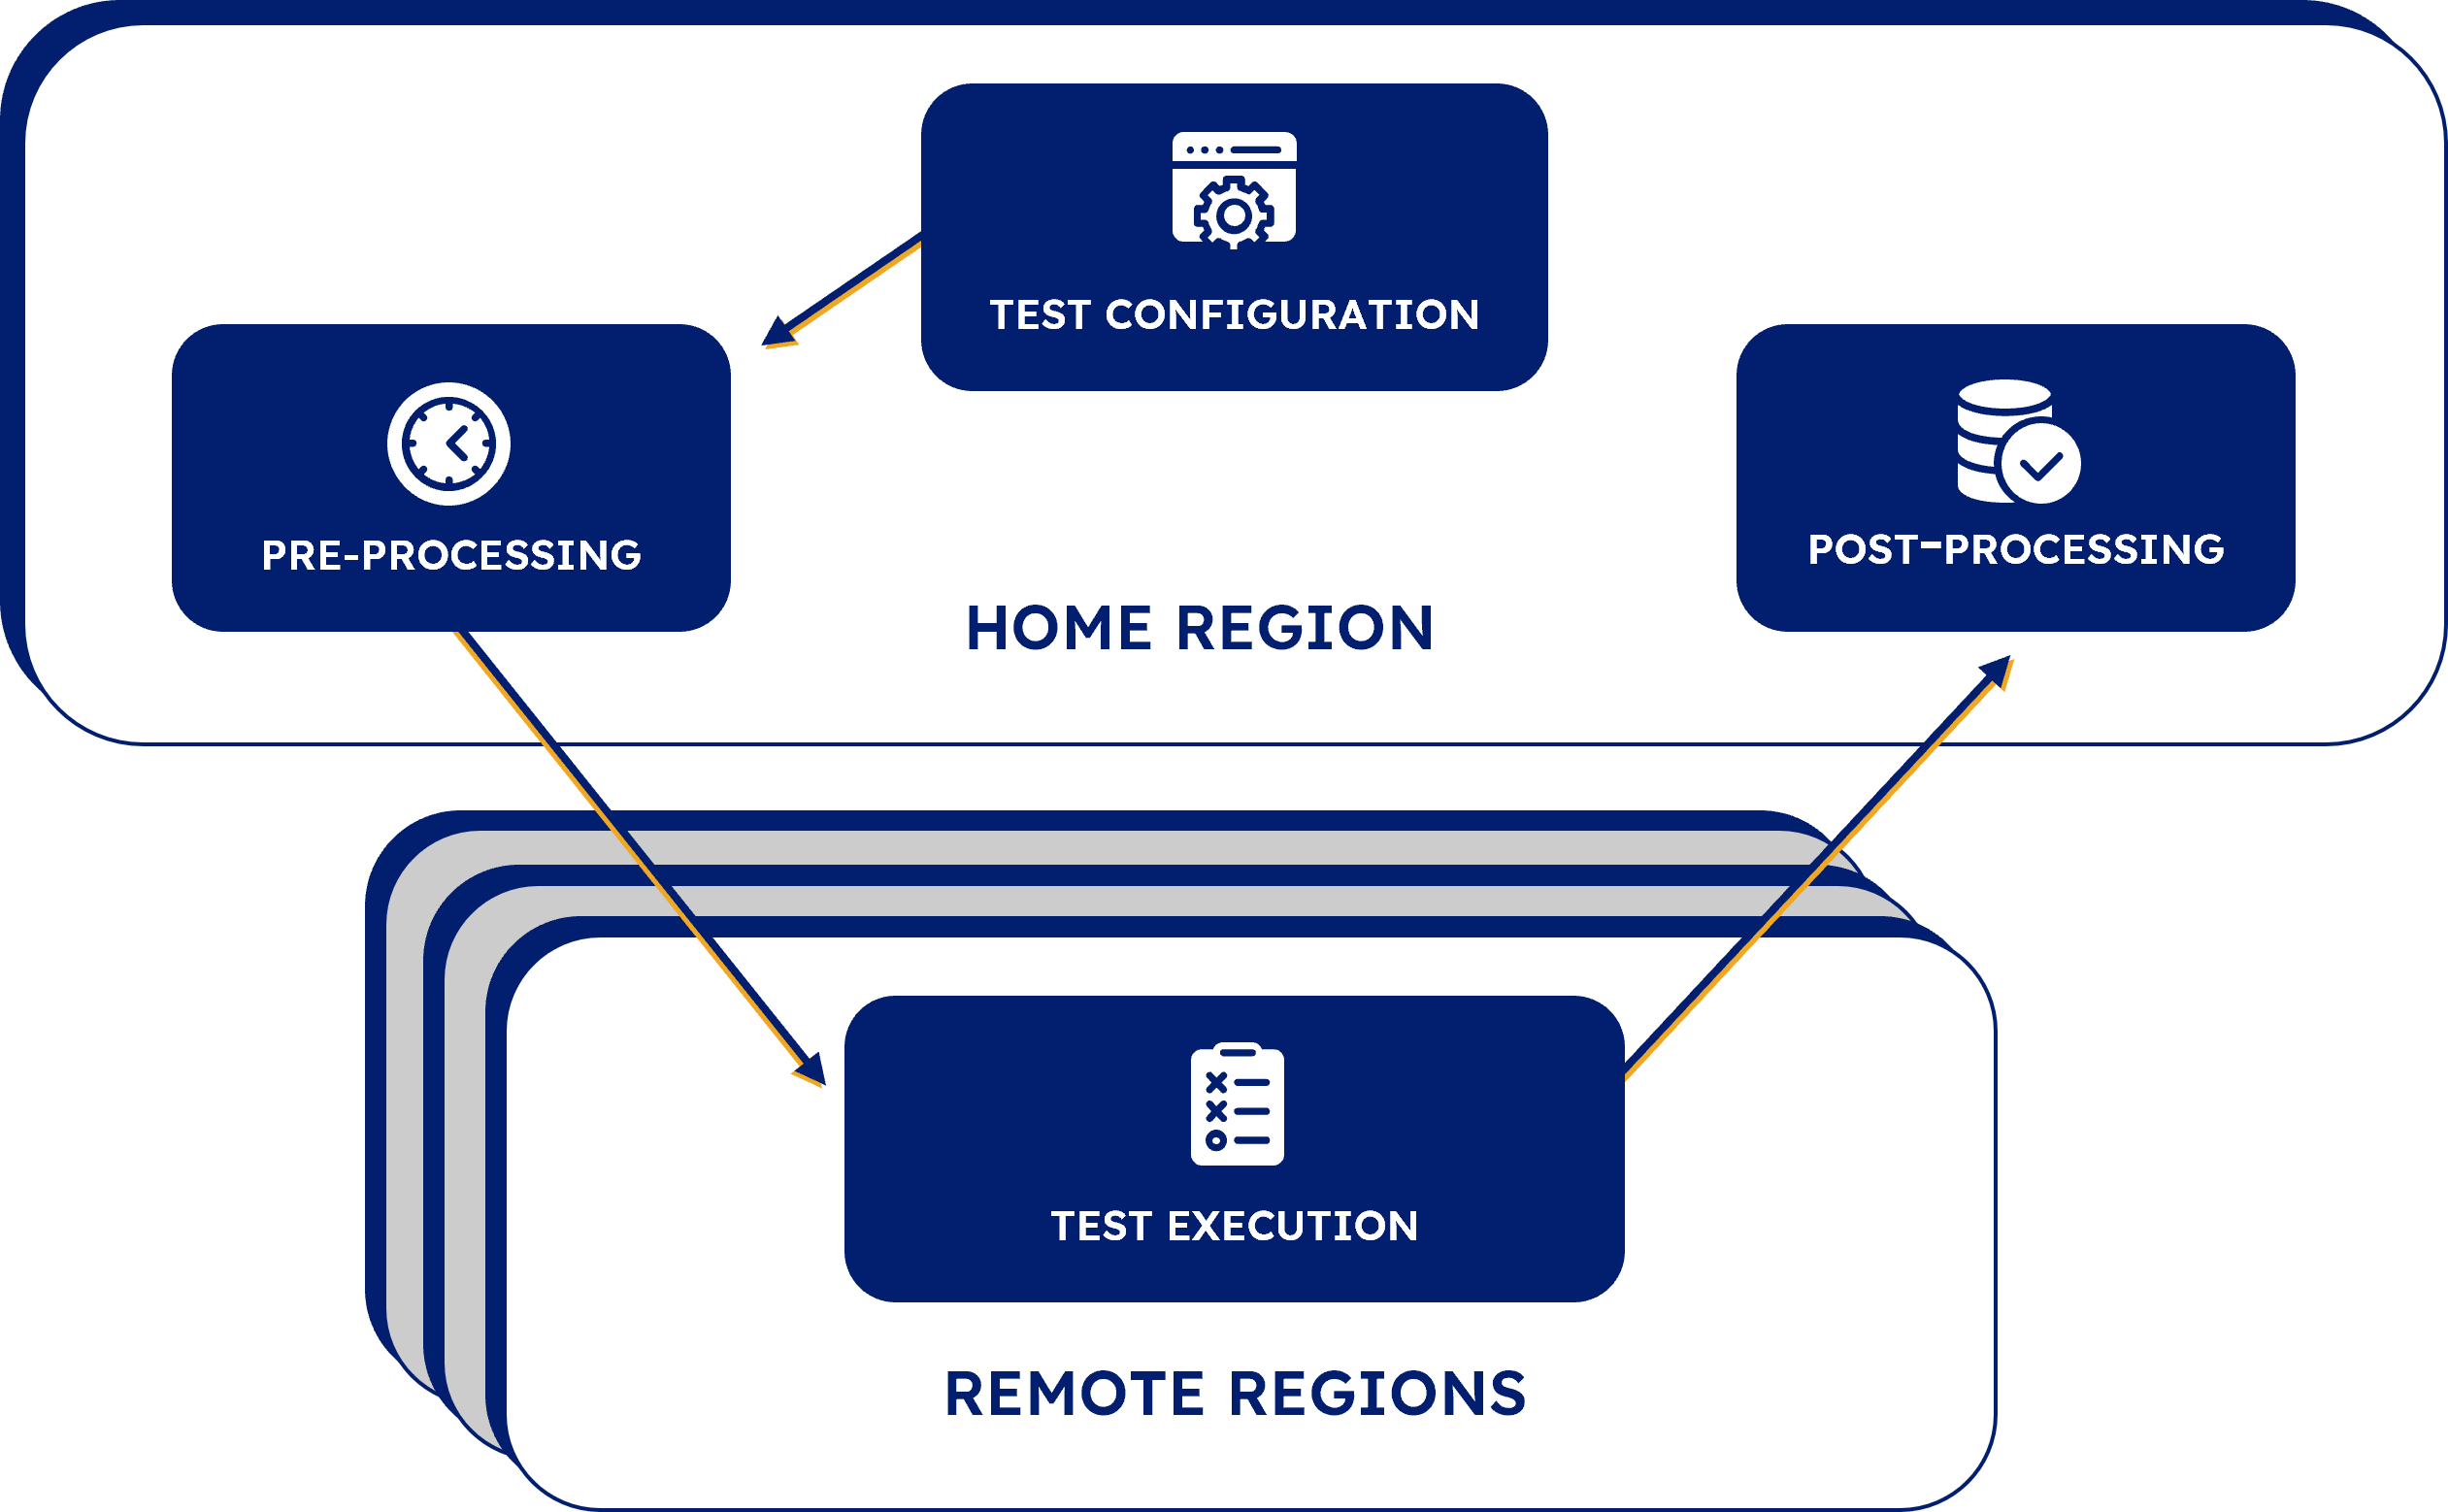
- Test Configuration, where tests are defined and saved.
- Pre-Processing, where tests are annotated with proper routing to the geographic regions where they’re configured to run.
- Test Execution, where the actual HTTP requests are made and responses are evaluated against assertions.
- Post-Processing, where test results are stored and alerts are triggered in the event of a failed test.
Home and remote regions
Before moving on, let’s define Home and Remote regions. When a user deploys Seymour, the user must select a main AWS region in which to set up the infrastructure. That’s what we are referring to as the Home Region. Everything needed to power the UI, the Backend Server, as well as the Test Configuration, Pre-Processing, and Post-Processing phases reside in the Home Region. The Test Execution phase happens in any number of the AWS regions selected when configuring a test, so the infrastructure for that phase is set up in all other available AWS regions, which we refer to as Remote Regions.
Next, let’s walk through the details of a single test’s journey through each of these phases in the “lifecycle loop”.
4.2. Test Configuration
The first part of the test loop is test configuration, where a user can define a test and Seymour saves the test for execution. Test configuration begins with the user creating and saving a new test in the Seymour UI. In the UI, the user can:
- Define the API endpoint
- Add assertions for the test
- Select the geographic origination points
- Select the time interval for test execution
- Define alert destination settings
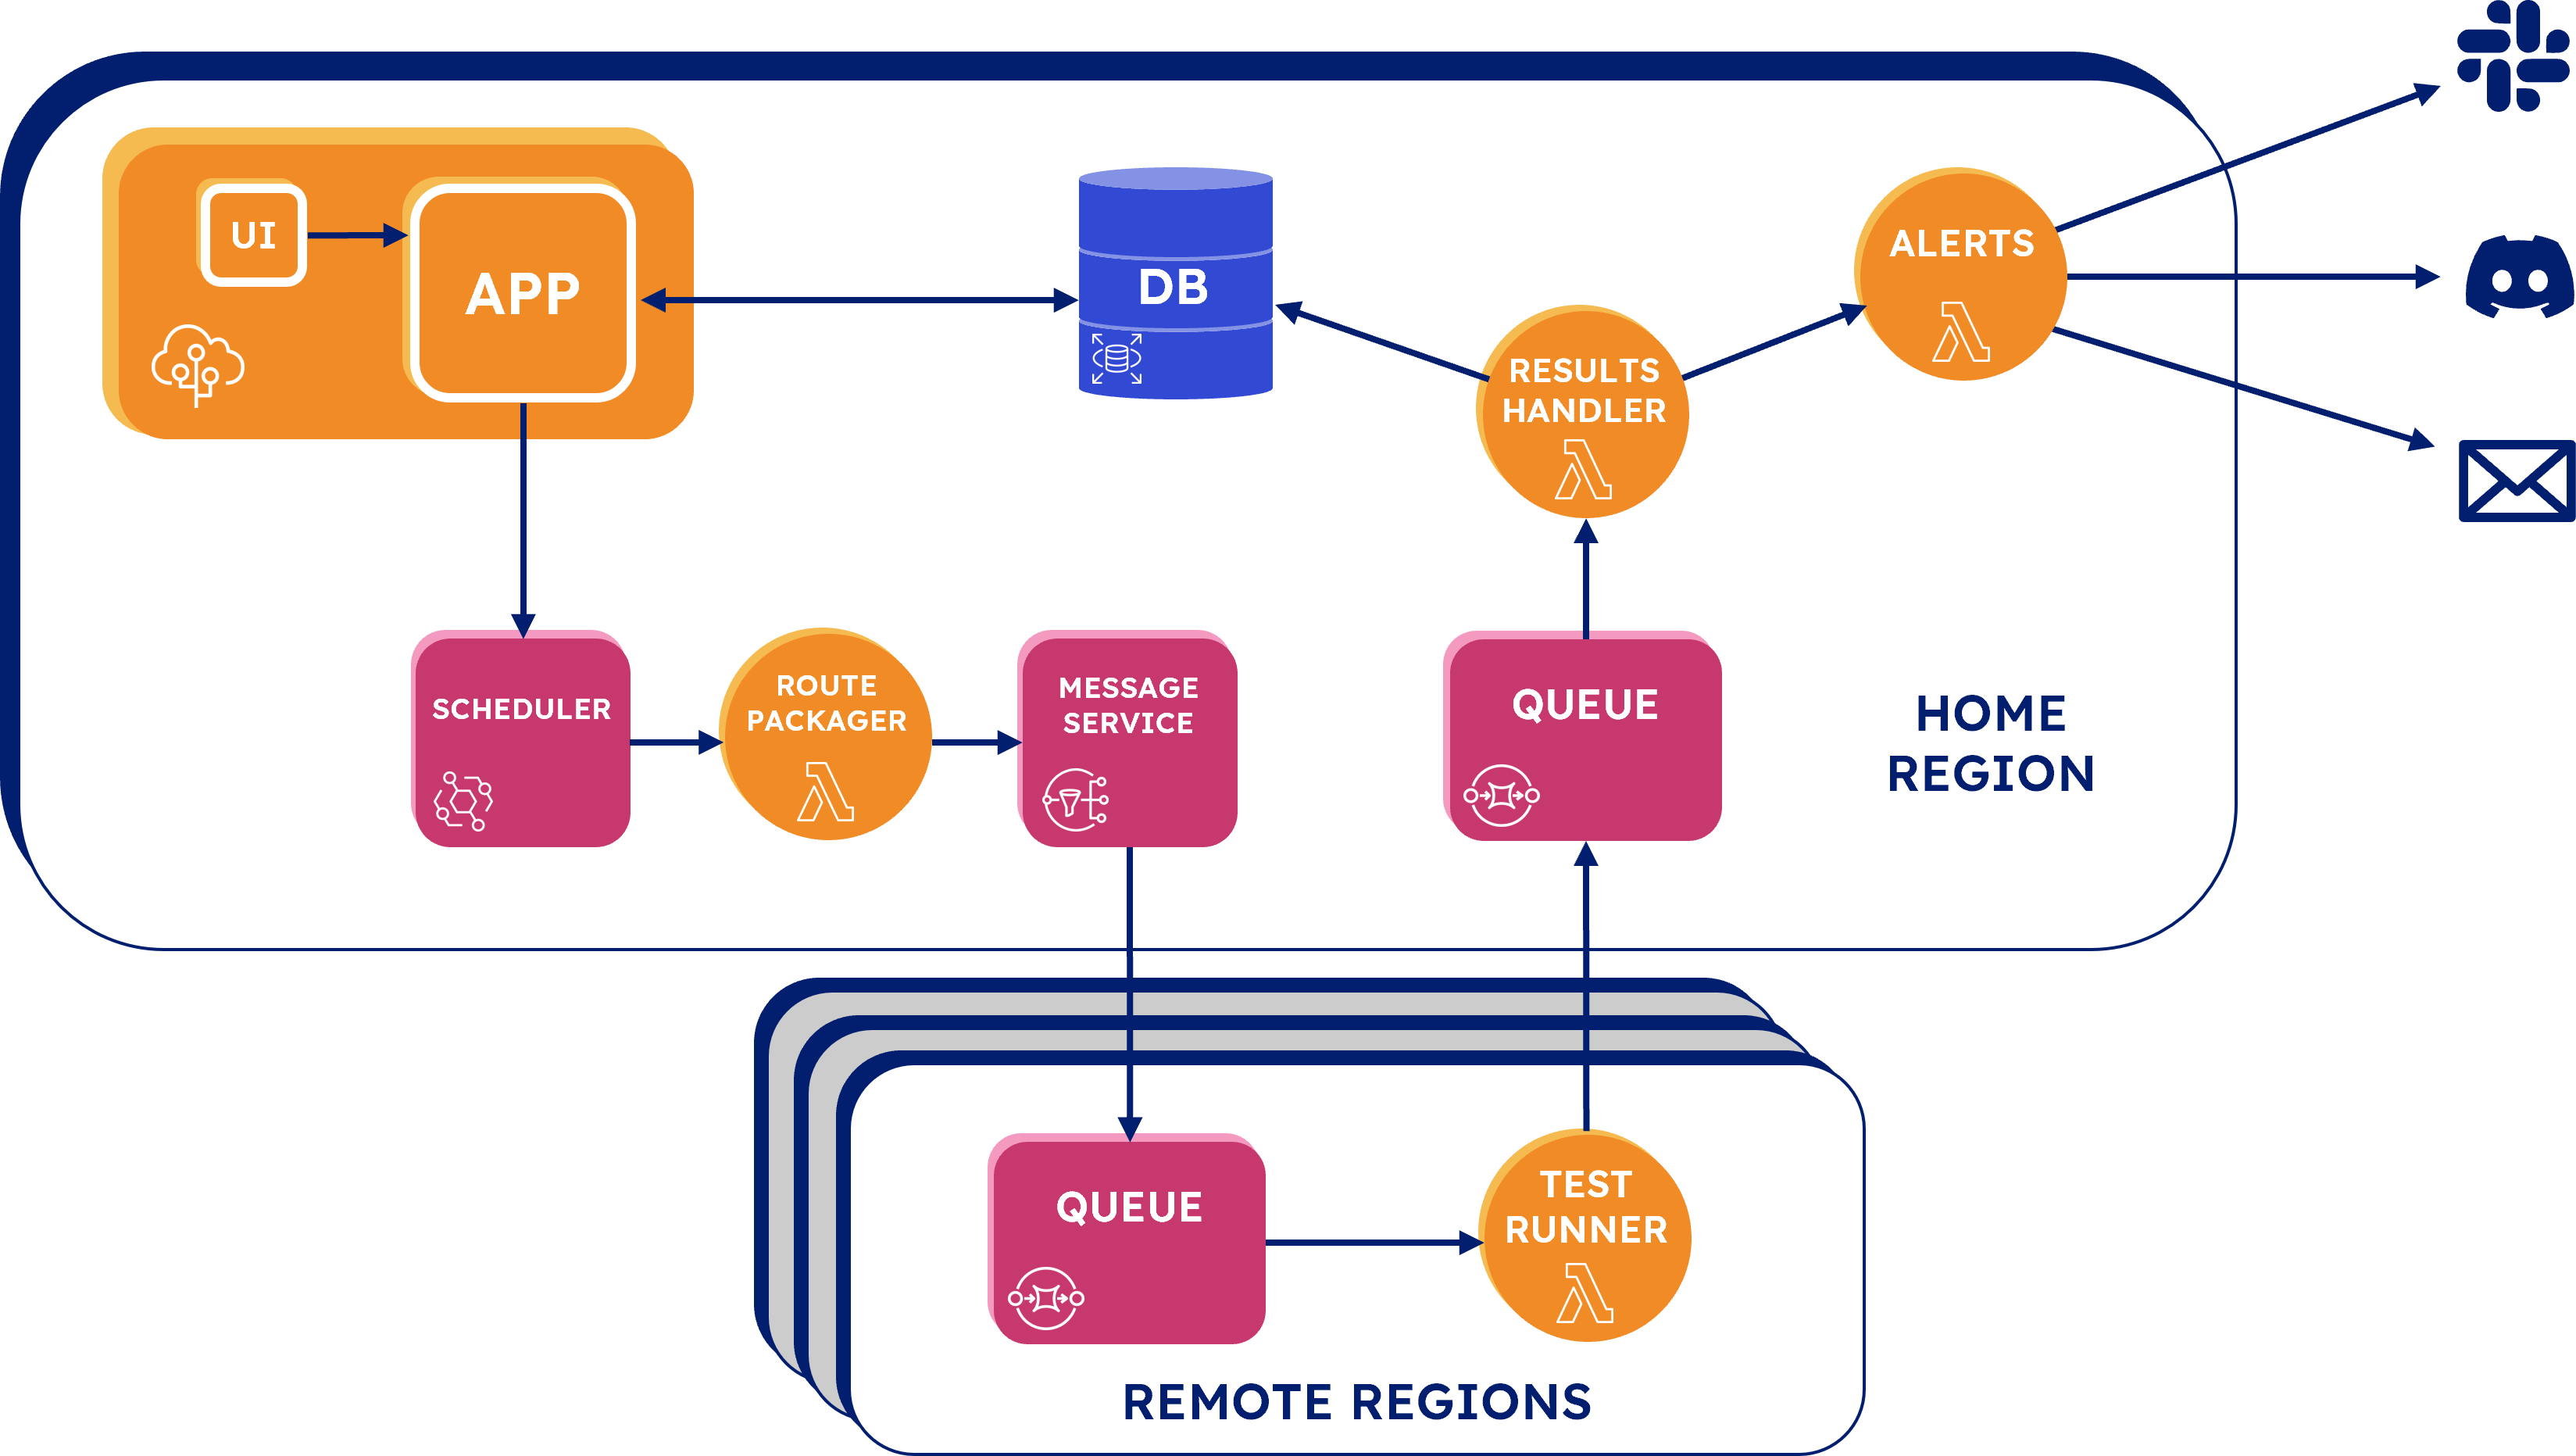
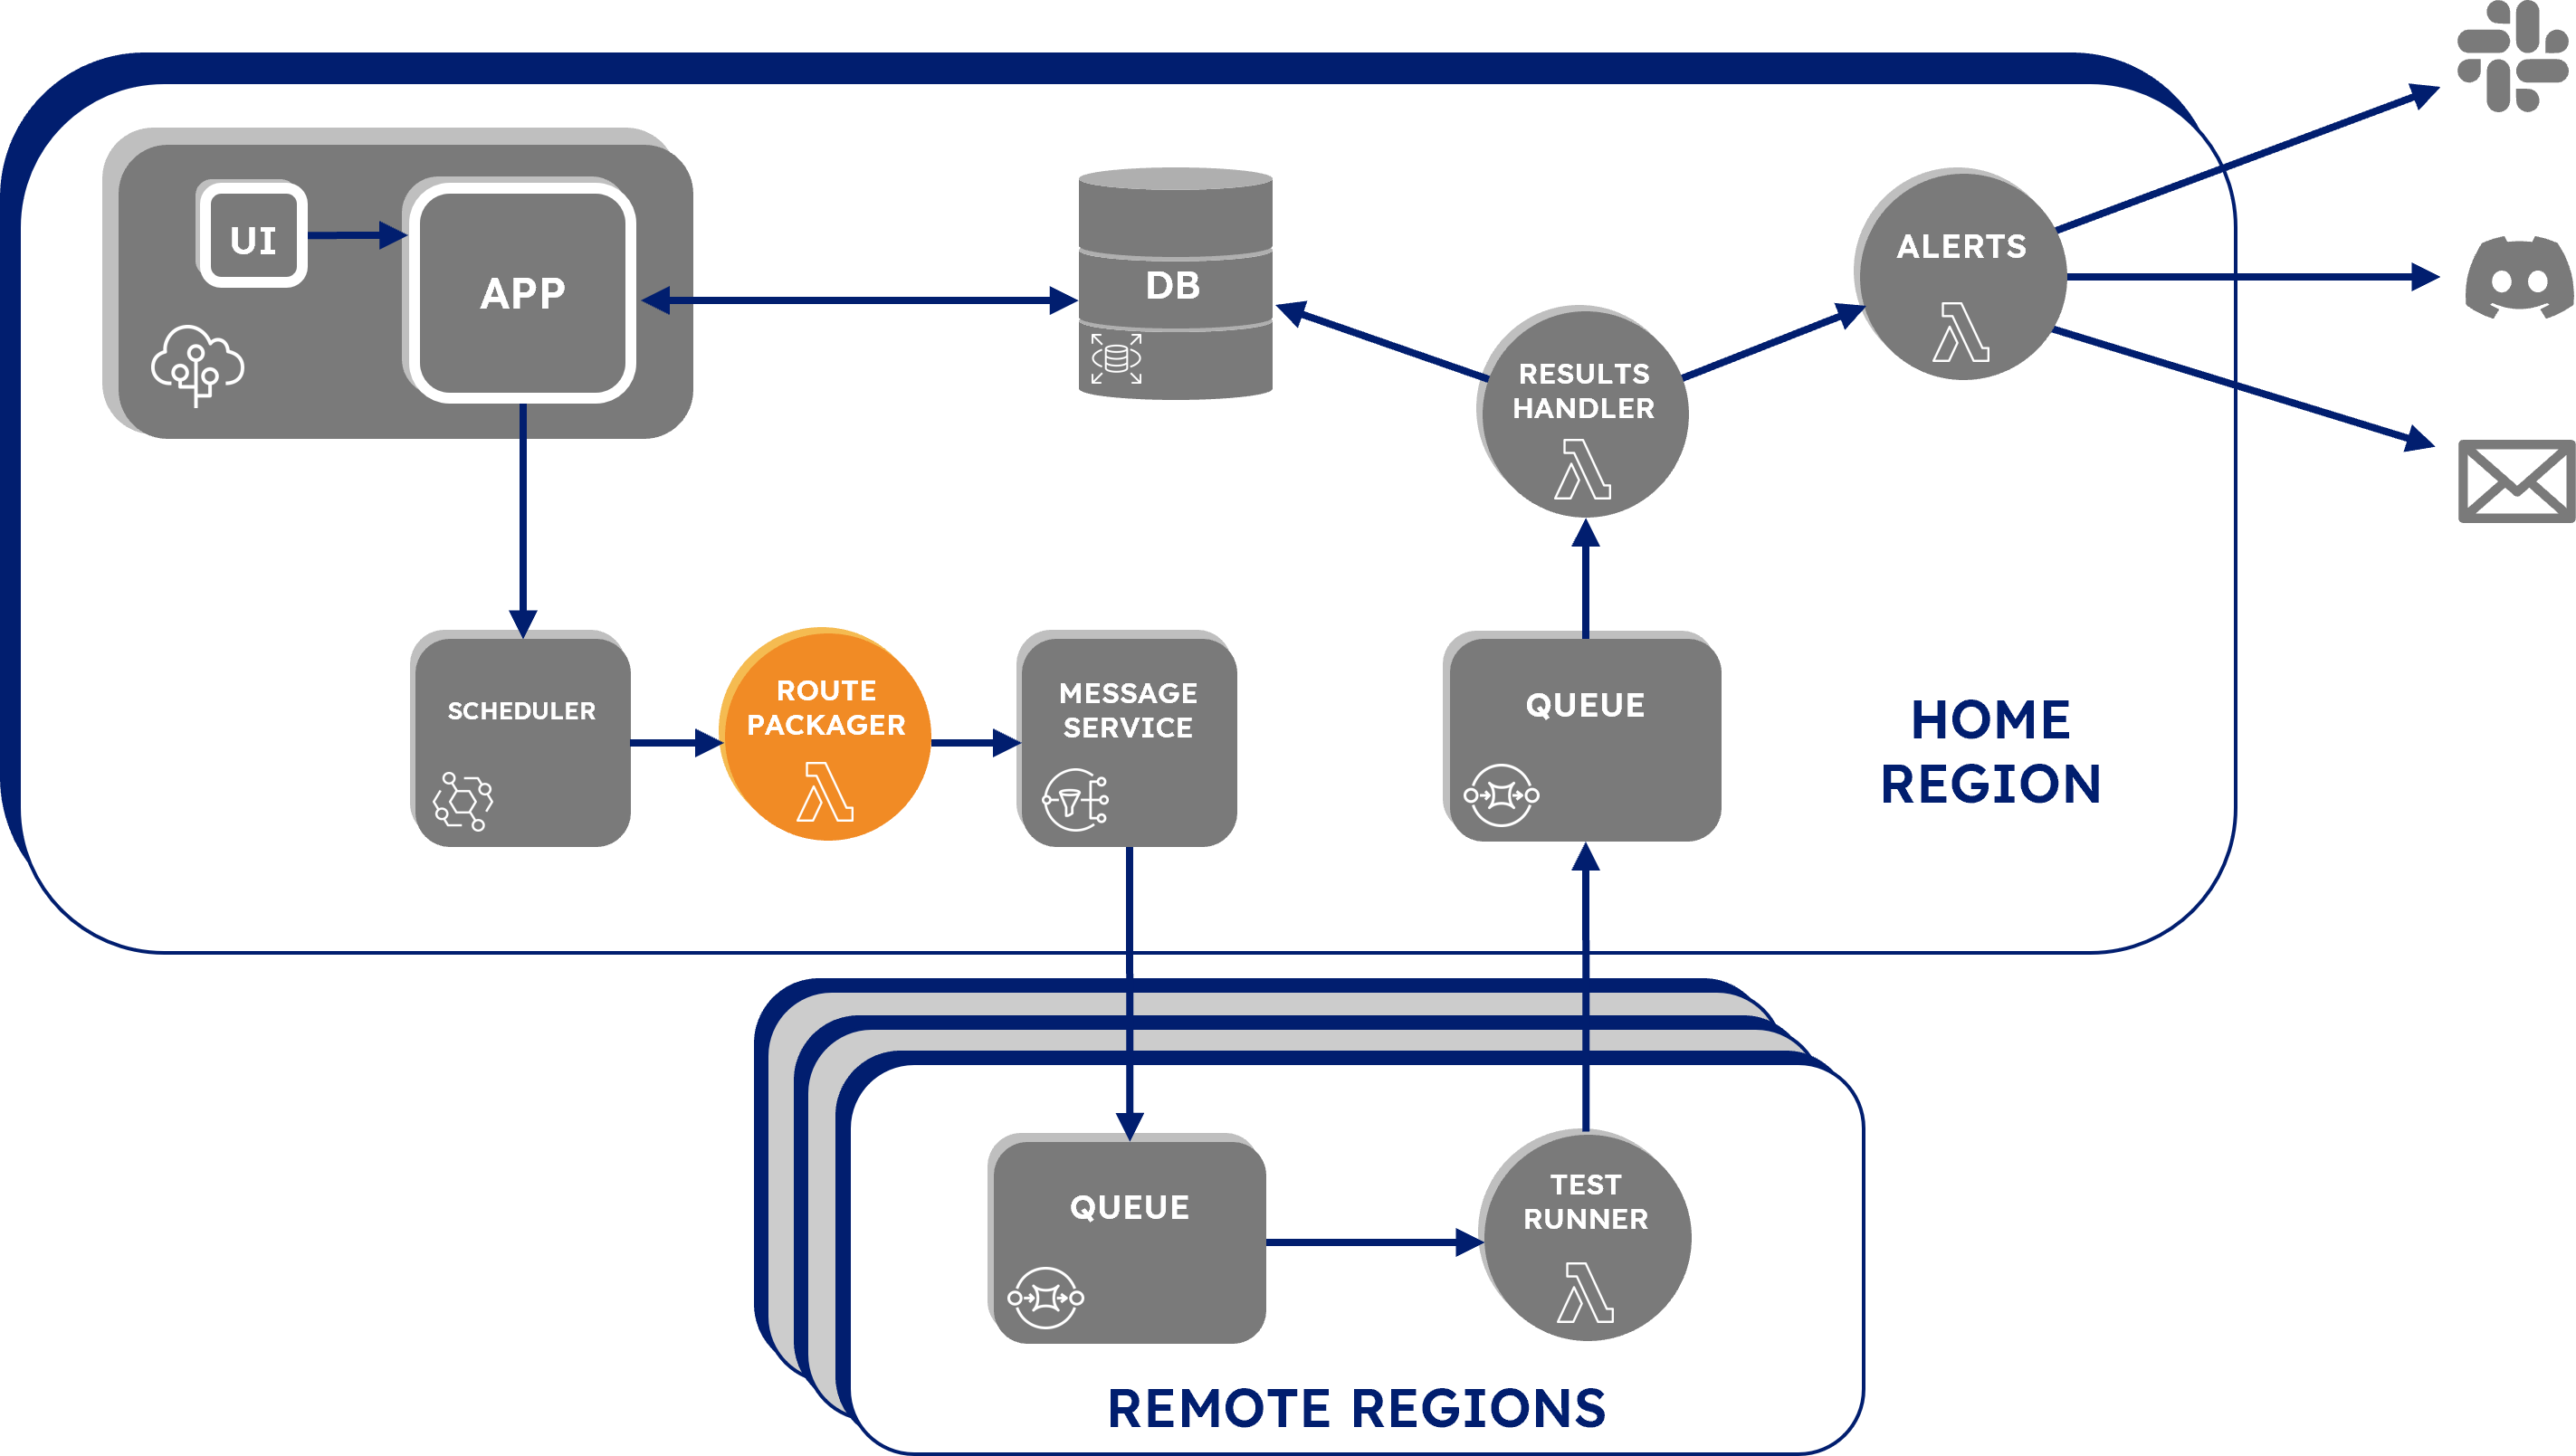
When the test is saved, it is sent from the UI to the backend app as a JSON test configuration. The backend app stores the test configuration in the database, assigns it an ID, and then passes it to EventBridge, a serverless event bus often used in AWS-based event-driven architectures. We are using EventBridge as our Scheduler service in order to run each test at the interval configured by the user. Each test is stored in our Scheduler as an EventBridge "Rule": a scheduled action that fires an event message at a fixed, recurring interval. The test configuration is saved to the rule as a payload of an event message that will be sent to the rule’s target every time it fires. Once a test has been scheduled, the backend app isn’t actually needed for the remainder of the test lifecycle.
4.3. Pre-processing
The next phase we will look at in the test loop is pre-processing. During this phase, a rule triggers each test run that is routed to the correct geographic region. As previously mentioned, a rule in our Scheduler fires an event message with the test configuration as its payload. The target destination for each rule is the Lambda function named “Route Packager”. Lambda is an AWS serverless compute service that lets you run code without having to provision or manage servers.
Route Packager's purpose is to send a message with the test configuration to SNS, Amazon's Simple Notification Service, that is only sent to the regions for which a test is configured to originate from. Route Packager reads the location data from the JSON test configuration payload and writes a region attribute for each location to the message. . It then sends the message, with the test configuration as its payload, to a topic in SNS. A queue in each region is subscribed to the topic and will only accept messages if they are intended for that region. Each queue does this with a subscription filter that discards all messages unless a message has a region attribute that matches the region of the queue.
4.4. Test execution
Up to this point, all the infrastructure we have looked at has been within the home region. The next phase, the Test Execution phase, can occur in one or more of the remote regions or the home region. The purpose here is to make the HTTP request to the endpoint, compare the response with the assertions, and send the results back to the home region.
As mentioned previously, there is a queue that first receives the message containing the test configuration from the home region SNS. The message is pulled from the queue by a “Test Runner” Lambda function. Test Runner makes a request to the API endpoint indicated by the test configuration and then compares the response to the assertions. If any of the assertions fail, then the whole test is marked as failed. Test Runner then sends this result back to a queue in the Home Region.
4.5. Post-processing
Back in the home region, each test enters the final phase, post-processing, where the results are saved to the database, and alerts are triggered for failed tests. The test results are received from Test Runner in a queue. A Lambda function, “Result Handler”, pulls from the queue and processes the test results. Result Handler first examines the results for whether the test passed or failed. Regardless of whether the test passed or not, Result Handler writes the results to the database. If it finds that the test failed, it immediately invokes another Lambda, “Test Alerts”, which handles alerting.
Test Alerts accepts a failed test result and queries the database for the relevant alerting data. This data consists of the types of alert channels selected by the user, which currently includes e-mail, Slack, and Discord. For each configured alert channel the query also returns a “destination” which is an email address or a webhook URL for Slack and Discord.
When the database query is complete, the Result Handler sends the test results to each alert channel.
Seymour's full architecture:
5. Engineering decisions and challenges
5.1. Build from bottom-up or wrap open-source?
While planning Seymour’s architecture, we quickly faced a critical decision: should we wrap an open-source project or should we build something from the bottom-up? After considering several options, we took a closer look at Monika.
5.1.1. Monika’s capabilities and limitations
Monika is an active monitoring tool designed to send out user-defined HTTP requests on a schedule and assess the responses. Out of the box, Monika can run complex API tests on scheduled intervals, handle alerting through integrations with popular platforms, and allow users to maintain ownership of their data.
We used Monika quite a bit in our research and, while it works well as a way to schedule and run HTTP tests, it lacked the following critical features.
First and foremost, Monika does not originate tests from different geographic locations: it’s limited to sending HTTP requests from the server it runs on.
Another limitation is that Monika is a command-line tool and does not have a user interface. It uses YAML files to configure tests, which doesn’t align with our goal of making tests easy to configure.
5.1.2. Challenges of wrapping Monika
We considered wrapping and extending Monika to achieve our requirements, as it offered some of the core functionality we wanted to implement. However, Monika requires a constantly running process, and we realized we would need to deploy the app to dedicated virtual machines in each of the 22 AWS regions we planned to support in order to give our users the option to generate multi-region tests. This approach presented a number of thorny questions:
- First, each virtual machine would require security, networking, and application configuration upon deployment. How would we make that easy for the user?
- To generate tests, Monika reads from a local YAML configuration file. How would we make sure that the config files were all in sync across the virtual machines?
- Additionally, 22 virtual machines would be difficult to maintain. How would we ensure the reliability of what was supposed to be an easy-to-use monitoring tool?
- Lastly, even if we were able to answer these questions and Monika was distributed across regions, how would we then send the test results back to the home region where the data would be processed?
After researching potential solutions to these problems, we decided that bending Seymour’s infrastructure to accommodate the portion of the functionality provided by Monika was not optimal.

5.1.3. Build
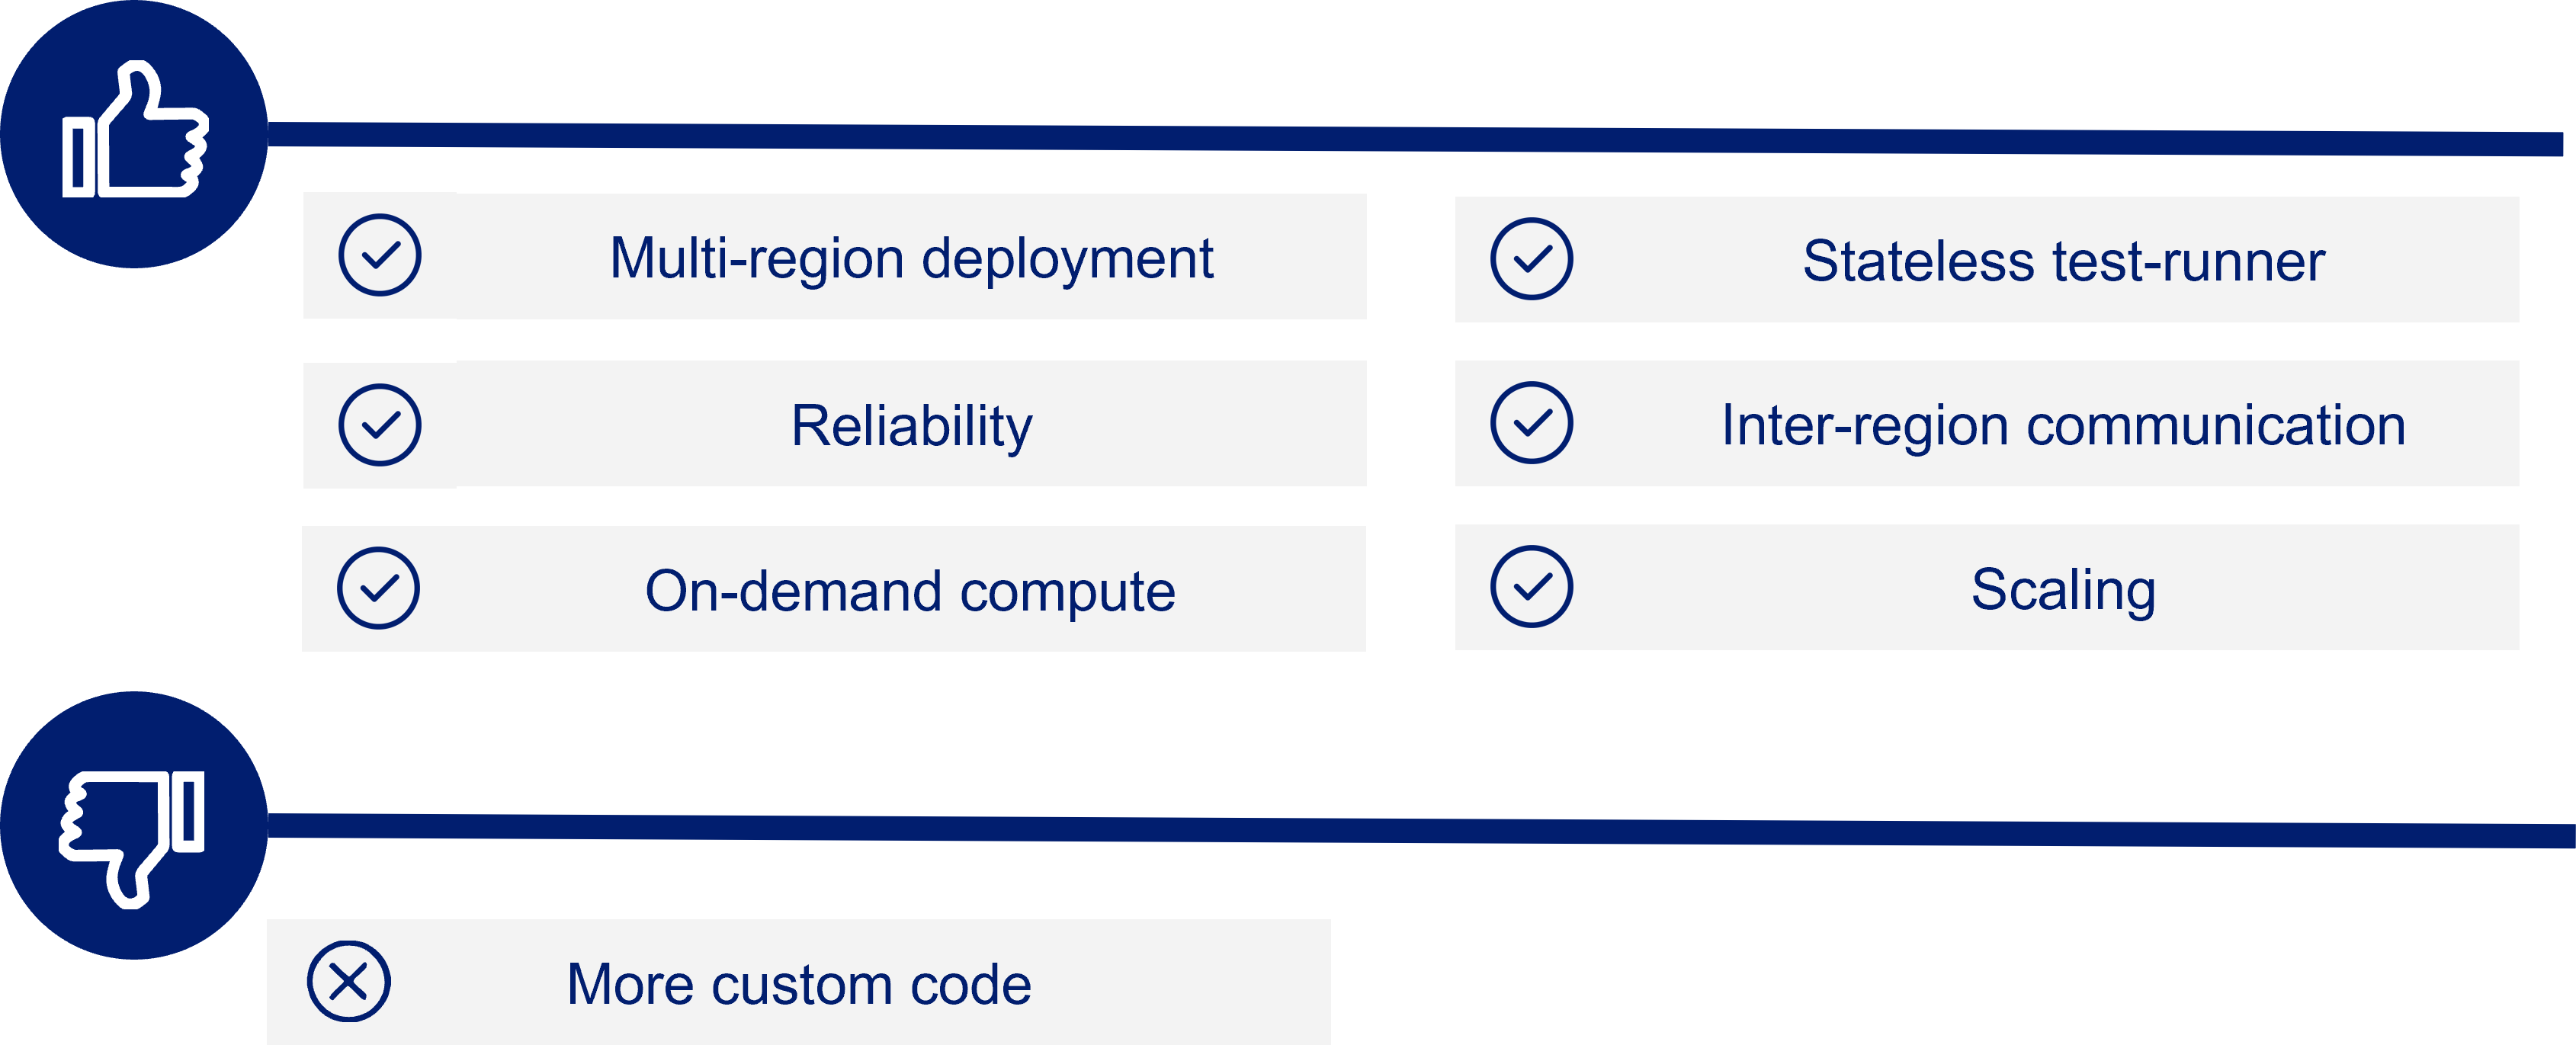
As shown in the overview of Seymour’s architecture, we ended up utilizing Lambda functions to achieve our requirement of multi-region testing. Instead of deploying an entire virtual machine running Monika to remote regions, Seymour simply deploys Test Runner, a Lambda function, coupled with a queue. Although we had to write more custom code, we found this setup to be superior in the following ways:
- Test Runner is easily deployed to all AWS regions with AWS’s Cloud Development Kit or CDK.
- Test Runner is stateless. Instead of distributing and thus needing to synchronize the test configuration data across regions, it remains in the home region and is communicated to Test Runner via SNS, the message broadcasting tool mentioned in the architecture overview.
- By placing a queue in front of Test Runner, we get a high degree of assurance that Test Runner will eventually process all incoming SNS messages.
- Communication of Test Runner's results back to the home region is simple thanks to Lambda’s ability to send results to a queue destination in another region.
- Rather than a constantly running virtual machine, Test Runner is invoked on demand. This eliminates the need to configure any virtual machines, reduces maintenance needs, and also reduces costs.
- Lambda functions scale on-demand, out of the box. If a user configures dozens of tests to run in the same region at the exact same time, Test Runner can handle the load.
In the end, by building Seymour from the ground up rather than wrapping a solution around Monika, we were able to fully take advantage of AWS cloud-native products, resulting in easy deployment and a low-maintenance user experience.
5.2. Why are we using Route Packager
Introducing the route packager Lambda function into Seymour’s architecture was the result of several interesting design decisions.
Route Packager is the target for all Scheduler “rules”. Recall that rules, in the context of Seymour, are simply scheduled events with an attached JSON test configuration.
We knew from the outset that we wanted Seymour to be able to efficiently run tests from different geographic locations. Deploying Test Runner to all remote regions achieved part of this plan, but a way to send test configurations to the Test Runner was not immediately apparent.
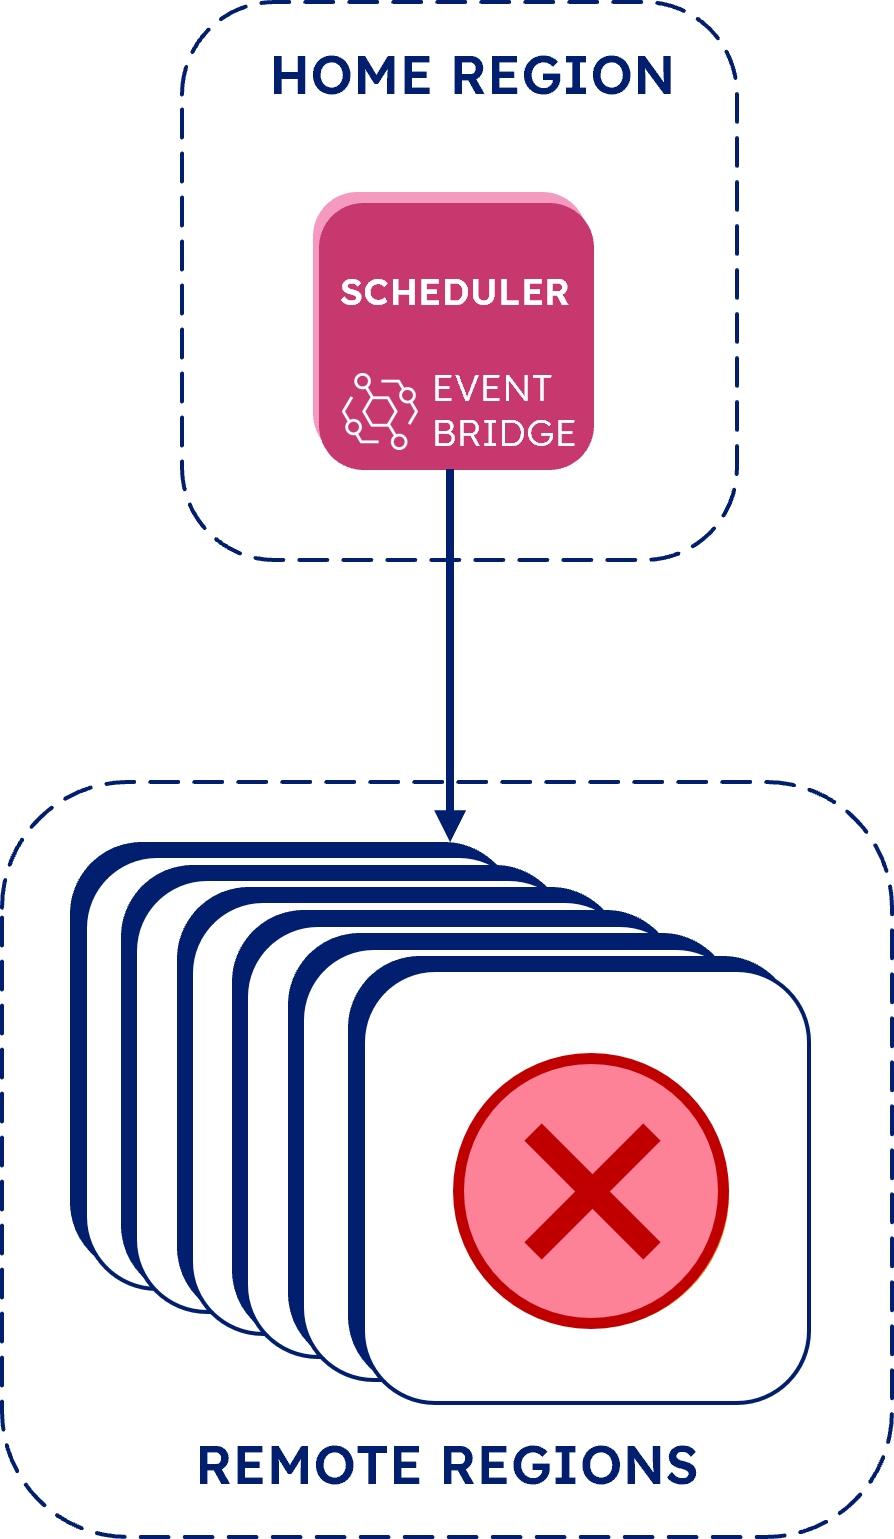
One option we looked at was directly invoking remote region test runner Lambdas from the scheduler rules. While EventBridge is technically capable of doing this, it has a five-target limit for any given rule. Because we wanted to support 22 targets, one for each region, we quickly discarded this approach.
We also tried using EventBridge’s “event bus” functionality, which is essentially another interface for communicating events in AWS, to connect home and remote regions. But we found that this approach prevented us from sending the test configuration JSON data to Test Runner, so we abandoned it.
Ultimately, we landed on using SNS to distribute scheduler events because of its ability to widely broadcast a message containing the test configuration across regions.
While this setup worked, it wasn’t efficient: for every rule that fired, a corresponding message would be delivered to every test runner Lambda. This was not ideal because every message would invoke all test runner Lambdas, causing each one to spin up and execute some code to check if it was an intended target, resulting in wasted compute time.
In order to make this message distribution more targeted, we added message filtering logic to the SNS topic subscriptions for each region so that only messages intended for a given region would be added to that region’s queue for processing by its Test Runner.
We still needed one last piece of functionality to make these subscription filters work: we needed to add some
region metadata to the message, something we couldn’t do with EventBridge alone.
This is why we built the route packager Lambda function. In Seymour’s final architecture, each fired rule first travels to Route Packager which translates the location data from the test configuration into attributes that it adds to the message before publishing to the SNS topic.
By combining Route Packager and SNS in the pre-processing phase of Seymour’s test loop, we were able to achieve our goal of efficient distribution of tests to remote regions.
5.3. The outcome: system resiliency
System resiliency was a priority for each phase of building Seymour because we wanted engineering teams to be able to focus on their core mission rather than worrying about their tools.
There are three pillars in Seymour’s overall approach to system resiliency:
Serverless Test Loop
First, we reached for AWS’s serverless offerings, including Lambda functions, throughout the test loop. As discussed in the wrap vs. build section, using serverless AWS resources allows Seymour to shift a good portion of operational responsibility and infrastructure management to AWS.
Decoupled architecture
By using AWS’s managed messaging services, we were able to decouple individual components of the system. This design provides assurances that test runs will be processed eventually even in cases of extremely high volume or if one of the components fails. As mentioned earlier, once a test is configured, it is able to run and generate alerts even if the UI and backend app aren’t available.
Auto failover
Lastly, we chose to deploy the backend app using AWS’s Elastic Beanstalk service, which reduces the risk of failures through automatic capacity provisioning, load balancing, and auto-scaling. Because the underlying infrastructure is fully managed by AWS, Elastic Beanstalk also provides automatic failover for terminated or unavailable virtual machine instances.
5.4. CDK: cross-region automated deployment
One of the foremost challenges we faced in building Seymour was automating the deployment of its AWS resources across multiple regions. Because ease of deployment was one of our main goals for the project, we wanted to limit the amount of infrastructure configuration required of the user.
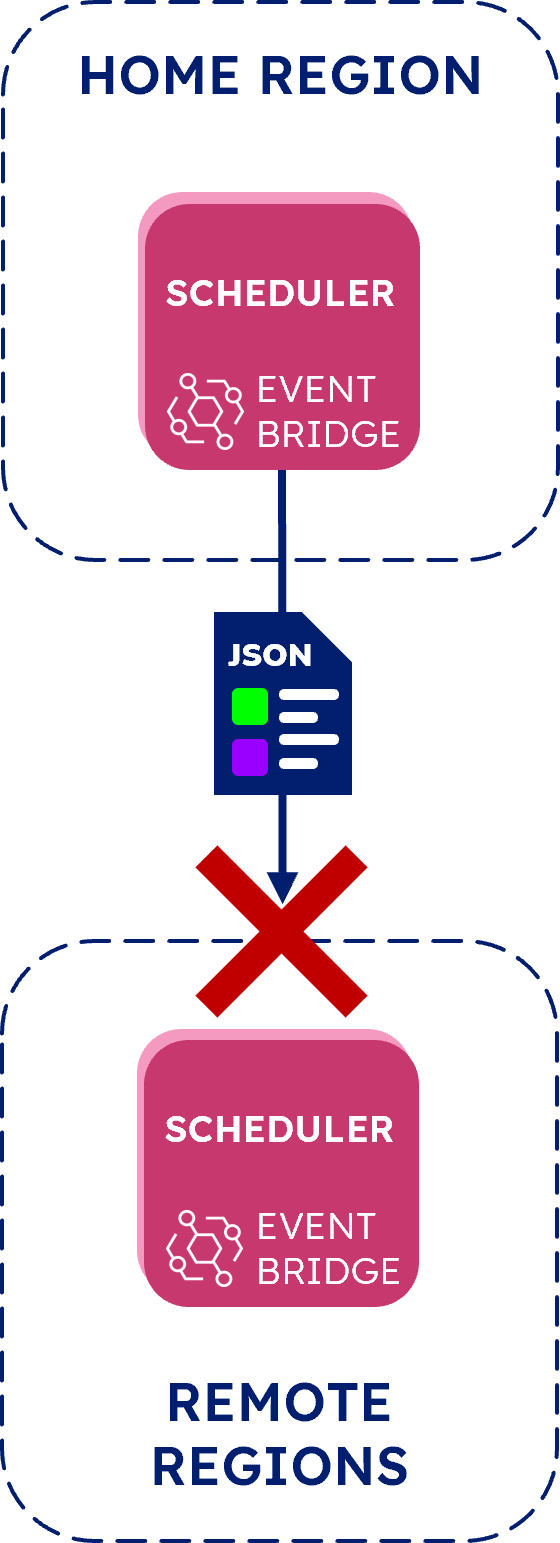
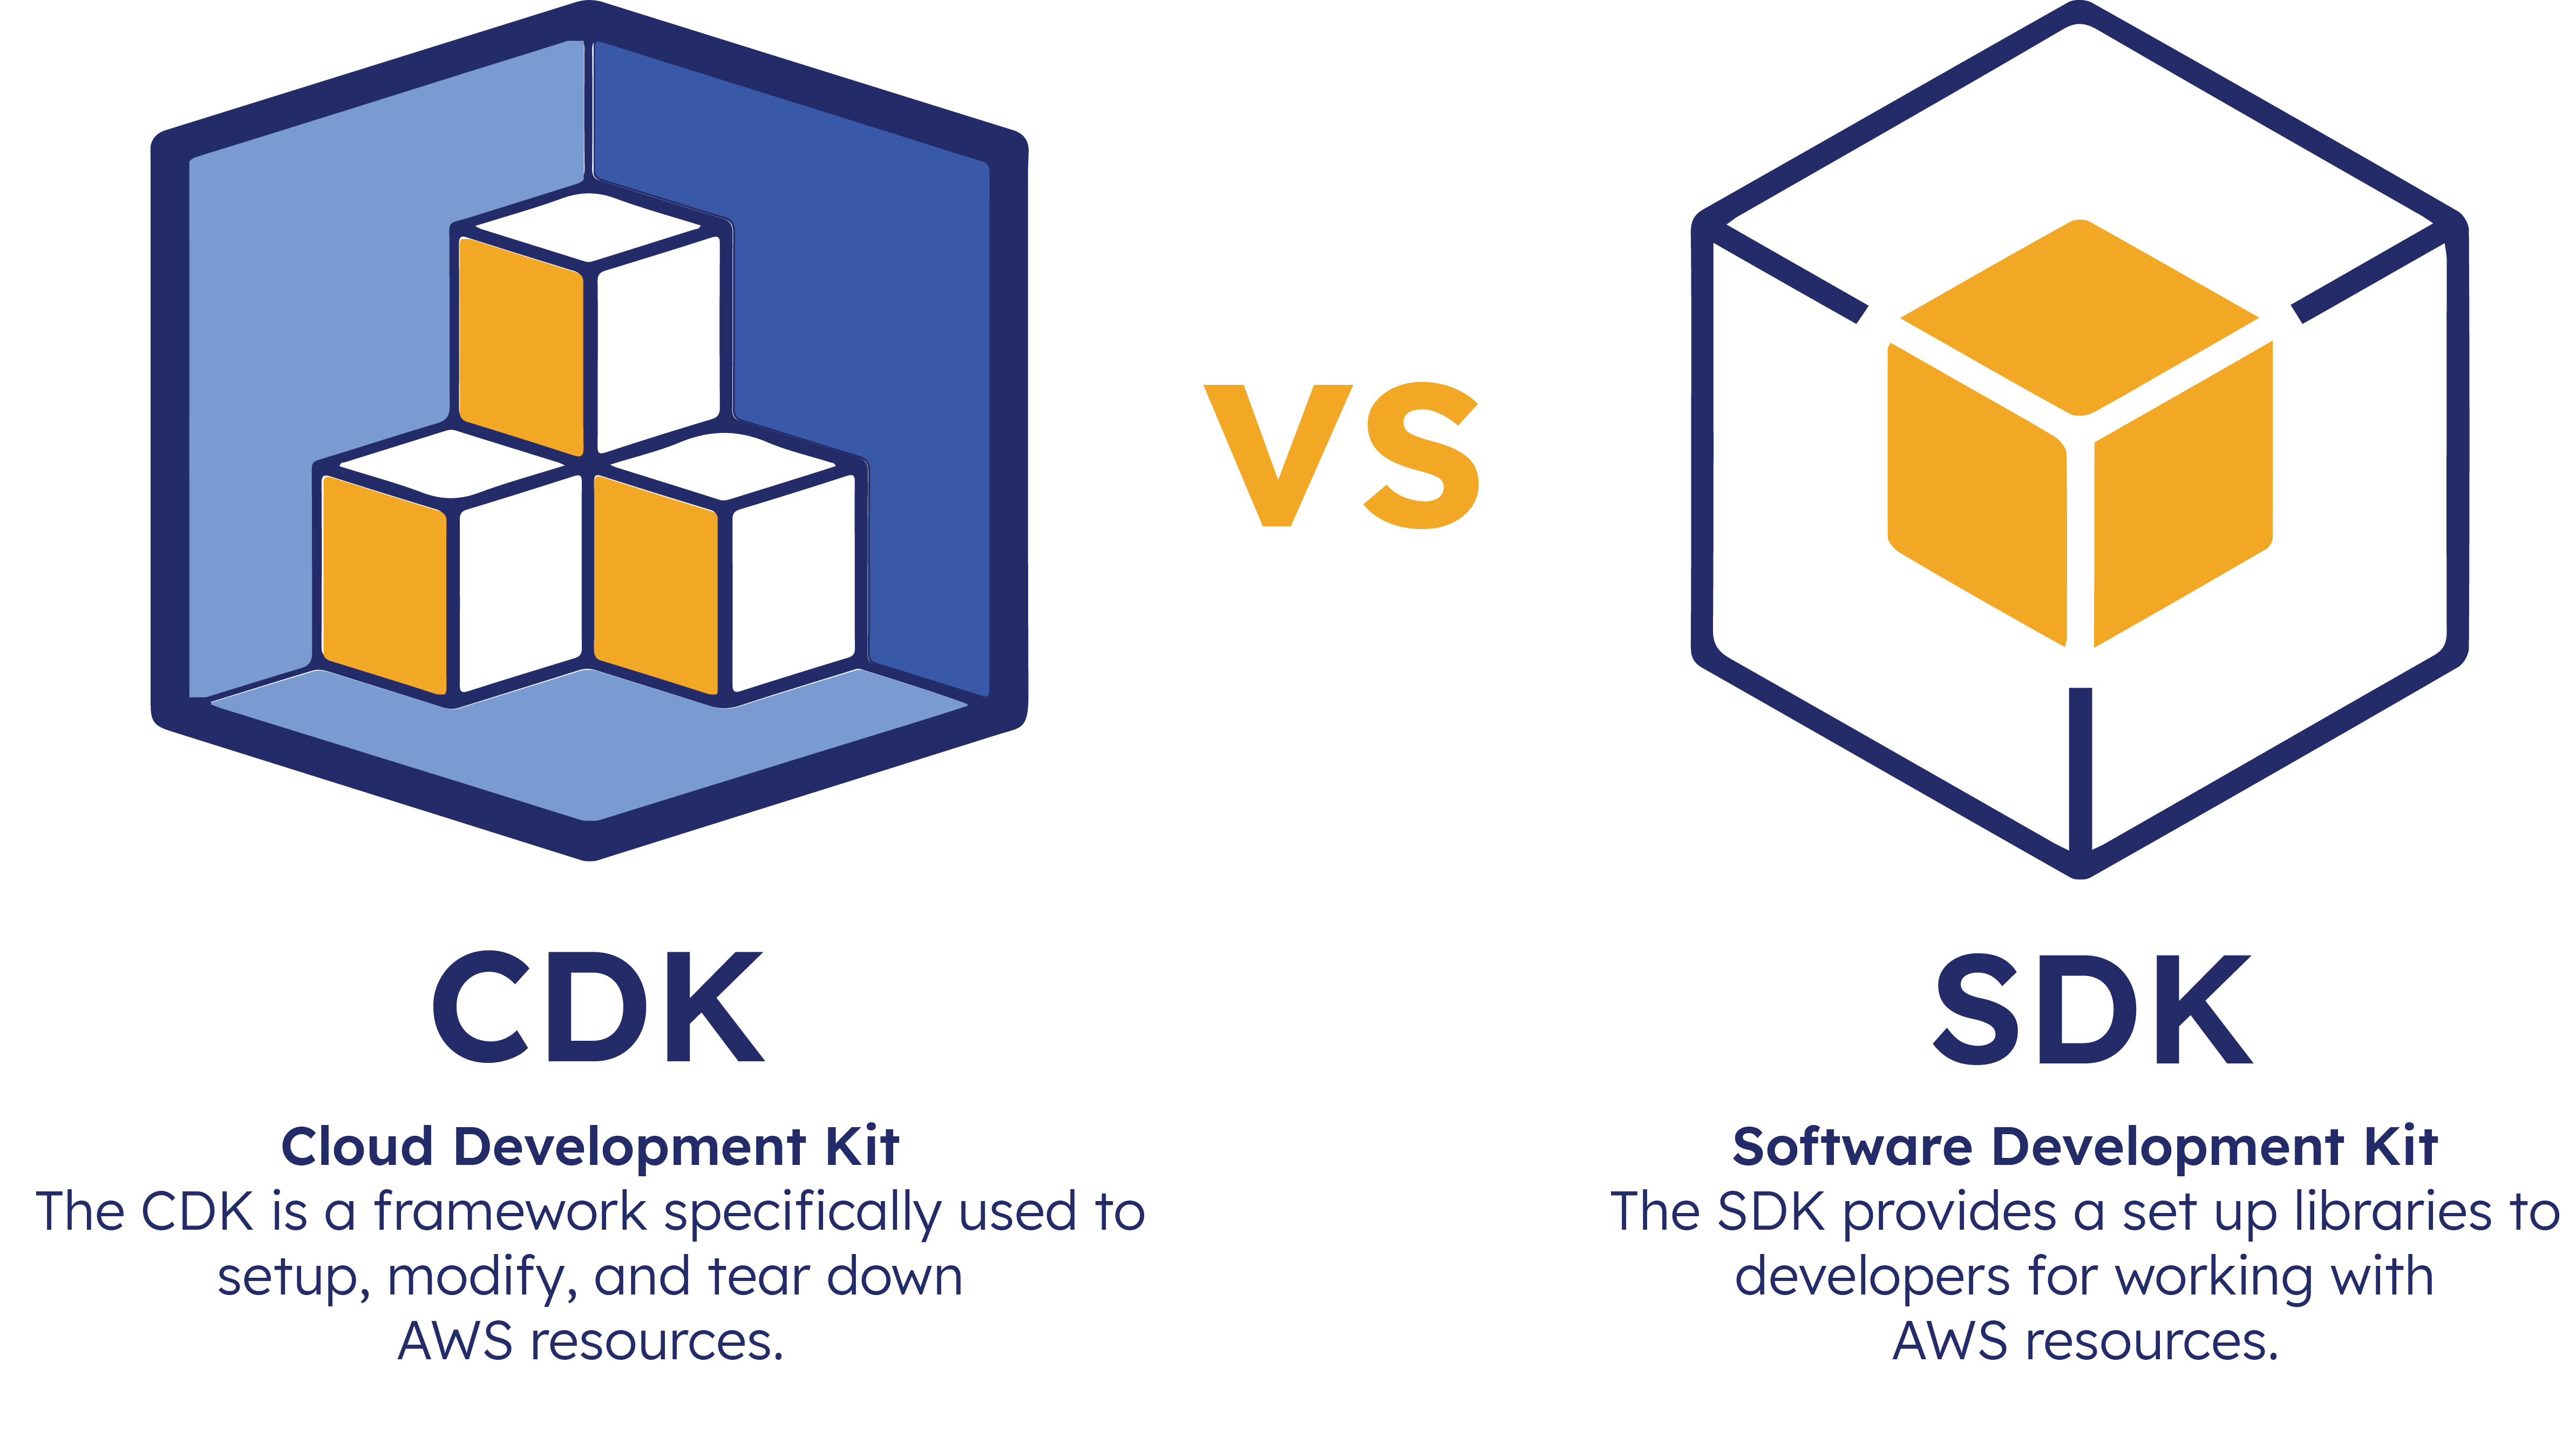
The main tool we used to deploy resources was the Cloud Development Kit, or CDK, which is an AWS service used to programmatically set up, modify and tear down resources. The CDK was relatively straightforward to work with for deploying and connecting infrastructure within the home region. However, this same approach did not work when it came to connecting resources between the home and remote regions.
One way of implementing a multi-region deployment is using a CDK pipeline. However, we continued to look for a
different approach because using the pipeline would add several more steps for the eventual user just to get
Seymour deployed on their own account. The user would need to fork the Seymour repositories and provide those
repo URLs to the CDK. Then in AWS Secret Manager, manually create a secret labeled ‘github-token’ and add a
GitHub Personal Access Token. We continued to look for an alternative that would require fewer setup steps for
the user.
Ultimately we were able to avoid having to use the CDK pipeline by introducing an additional AWS tool, the SDK. While the CDK is a framework used specifically to set up, modify, and tear down AWS resources, the SDK simplifies the use of AWS services by providing a set of JavaScript libraries that can be used directly in an application’s code. Instead of enabling cross-region communication with the use of the CDK pipeline during deployment, we implemented a few functions with the SDK in Test Runner’s code, which allows it to connect to the Home Region at runtime. This kept the deployment process lean and the complexity to a minimum for the installing user.
6. Future work
We're excited to continue expanding Seymour’s functionality. Here are some of the features we'd like to implement:
'Smart' alerting
At the moment, Seymour provides three ways of alerting: Slack and Discord via webhooks or email via SES (Amazon's Simple Email Service). One of the limitations is that the alerting system triggers notifications for every failed test. This means that a test failure in twelve different locations triggers twelve separate alerts. In the future, we would like to implement a feature allowing users to determine how many failures they wish to be notified on, along with alert aggregation.
Teardown scripts
Currently, Seymour does not have the functionality to run tear-down scripts. Tear-down scripts are custom scripts supplied by the user which are executed after tests run. A tear-down script could be used, for example, to send an additional request to clear out any test data generated from a POST request test. As it stands, the user will have to rely on other mechanisms to clear out data generated by Seymour in their production system.
Allowing integration with a CI/CD pipeline
Seymour tests are designed to run on a set schedule but can also be triggered on demand with the ‘run now’ button. In the future, we’d like to give users the ability to trigger tests and evaluate results from a CI/CD pipeline so Seymour can be fully integrated with DevOps processes.
8. References
- Falé F., Gebhardt S. 2017 Jan 25. SyntheticMonitoring [blog]. Martin Fowler Blog [accessed 2022 Aug 10]. (https://martinfowler.com/bliki/SyntheticMonitoring.html)
- Ejsmont A. 2015 Jul 3. Web Scalability for Startup Engineers 1st Edition. McGraw Hill Professional.
- Kleppmann M. 2017 Mar. Designing Data-Intensive Applications. O'Reilly Media, Inc.
- Carlbark J. 2018 May 07. Synthetic Monitoring: A Case Study of the Meltwater API [blog]. Under The Hood: The Official Mealtwater Engineering Blog [accessed 2022 Jul 25]. (https://underthehood.meltwater.com/blog/2018/05/07/synthetic-monitoring-a-case-study-of-the-meltwater-api/)
- Fowler M. 2018 Jan 16. IntegrationTest [blog]. Martin Fowler Blog [accessed 2022 Aug 23]. (https://martinfowler.com/bliki/IntegrationTest.html)
- Nolet T. 2019 Jul 09. How I made AWS Lambda work for my SaaS [blog]. Checkly Blog [accessed 2022 Jul 20]. (https://blog.checklyhq.com/how-i-made-aws-lambda-work-for-my-saas/)
- Rago G. 2020 Jun 18. How we monitor Checkly's API and Web App (updated) [blog]. Checkly Blog [accessed 2022 Jul 20]. (https://blog.checklyhq.com/how-we-monitor-checkly/)
- Winton J. 2019 Aug 1. Transitioning Production Tests into a Synthetic Monitoring Solution [tech-talk]. LaunchDarkly. [accessed 2022 Jul 15]. (https://www.youtube.com/watch?v=xEqRLYa454A&list=PLq8koenaAJWt0xHjS04HFZ1ighFDp3UVK&index=16)
- Artillery Reference Documentation. Artillery. [accessed 2022 Jun 04]. (https://www.artillery.io/docs/guides/overview/why-artillery)
- AWS CDK 2.38.1 Reference Documentation. Amazon Web Services. [accessed 2022 Aug 15]. (https://docs.aws.amazon.com/cdk/api/v2/)
- AWS SDK for JavaScript Documentation. Amazon Web Services. [accessed 2022 Aug 01]. (https://docs.aws.amazon.com/sdk-for-javascript/index.html)
- Get started with synthetic monitoring. New Relic Reference Documentation. [accessed 2022 Jun 05]. (https://docs.newrelic.com/docs/synthetics/synthetic-monitoring/getting-started/get-started-synthetic-monitoring)
- Monika Reference Documentation. Monika. [accessed 2022 Jul 03]. (https://monika.hyperjump.tech/overview)
- CDK Patterns. [accessed 2022 Aug 02]. (https://cdkpatterns.com/patterns/)
Citations:
Books:
Articles:
Tech-Talks:
Documentation:
Miscellaneous Resources:
9. Team